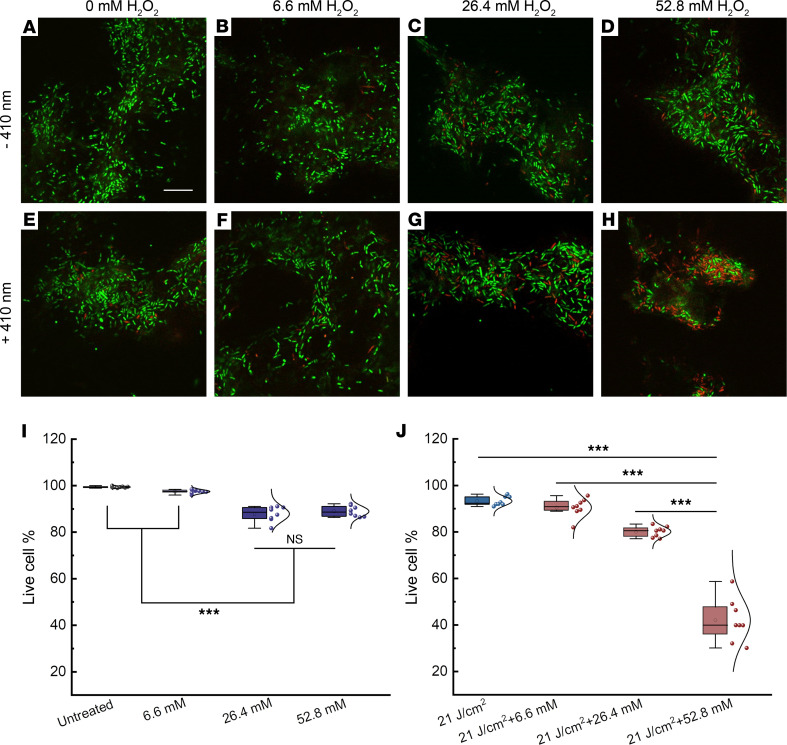
Figure 5. Confocal laser scanning microscopy of live/dead bacteria inside P. aeruginosa PAO1 biofilms after different treatments.
(A–D) Merged live/dead P. aeruginosa biofilms with various H2O2 treatments. (E–H) Merged live/dead P. aeruginosa biofilms after 410 nm exposure combined with various H2O2 treatments. (I and J) Quantitative analysis of the live-cell percentage of P. aeruginosa biofilms among the above 8 groups. Live-cell percentage was calculated from 8 different fields of view. Box-and-whisker plots: mean, circle; median, horizontal line; box range, percentiles 25, 75. Scale bar: 10 μm. Live: SYTO 9. Dead: PI. 410 nm laser: ns-410 nm, 35 mW, 10 minutes. H2O2: 30-minute incubation time. Statistical analysis was determined through Student’s 2-tailed unpaired t test and 1-way ANOVA. ***P < 0.001.

