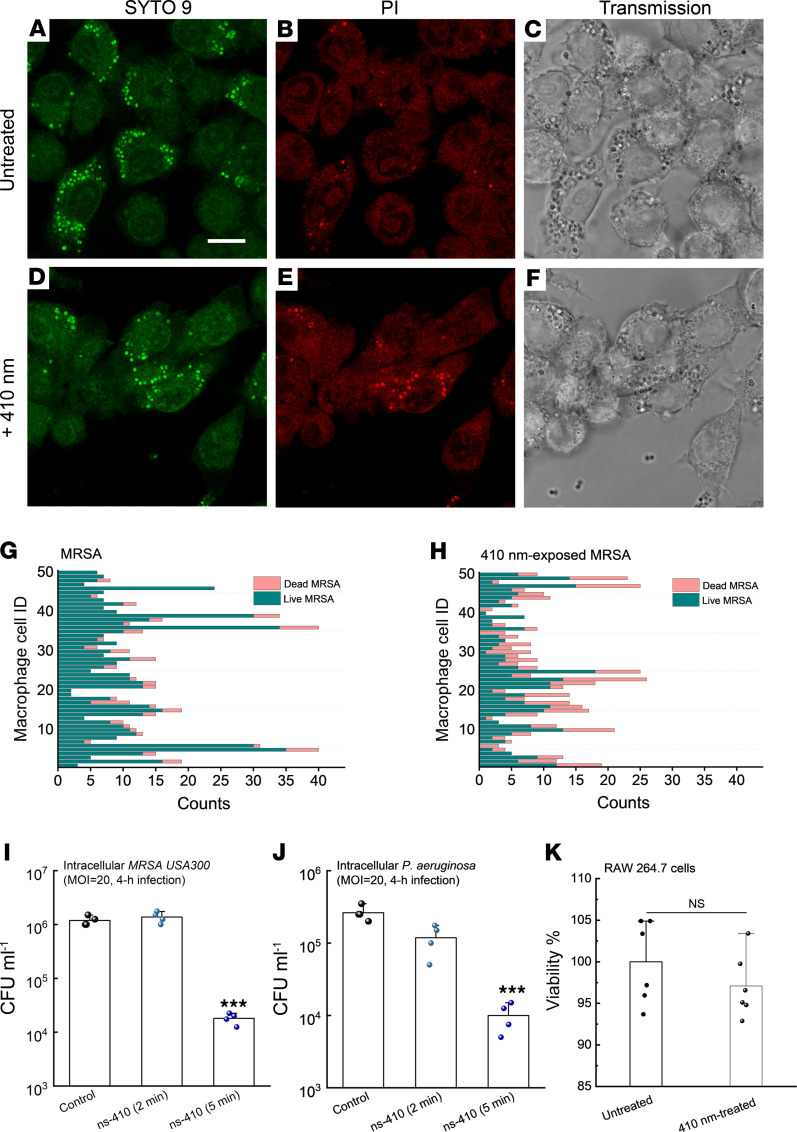
Figure 6. Photoinactivation of catalase assists macrophages to eliminate intracellular bacteria.
(A–C) Confocal images of live (SYTO 9, A), dead (PI, B), and corresponding transmission images (C) of intracellular MRSA USA300 inside RAW 264.7 macrophages after MRSA USA300 infected RAW 264.7 cells for 1 hour at a MOI of 100 in serum-free DMEM. (D–F) Confocal images of live (SYTO 9, D), dead (PI, E), and corresponding transmission images (F) of intracellular MRSA USA300 inside RAW 264.7 macrophages after 410 nm–exposed MRSA USA300 infected RAW 264.7 cells for 1 hour at an MOI of 100. 410 nm: 35 mW/cm2, 8 minutes. (G and H) Quantitative analysis of the amount of live/dead MRSA inside single RAW 264.7 cells from the above 2 scenarios. Imaging result was a representative of 2 biological repeats. (I) CFU/mL of intracellular MRSA USA300 after MRSA (with/without 410 nm exposure) infected RAW 264.7 cells for 4 hours at an MOI of 20. (J) CFU/mL of intracellular P. aeruginosa after P. aeruginosa PAO1 (with/without 410 nm exposure) infected RAW 264.7 cells for 4 hours at an MOI of 20. (K) Survival percentage of uninfected RAW 264.7 cells with/without 410 nm exposure. 410 nm: 50 mW/cm2. Data: Mean + SD from 3 replicates for panels I–K. Significant difference was determined by 1-way ANOVA (significant from other 2 groups). ***P < 0.001.

