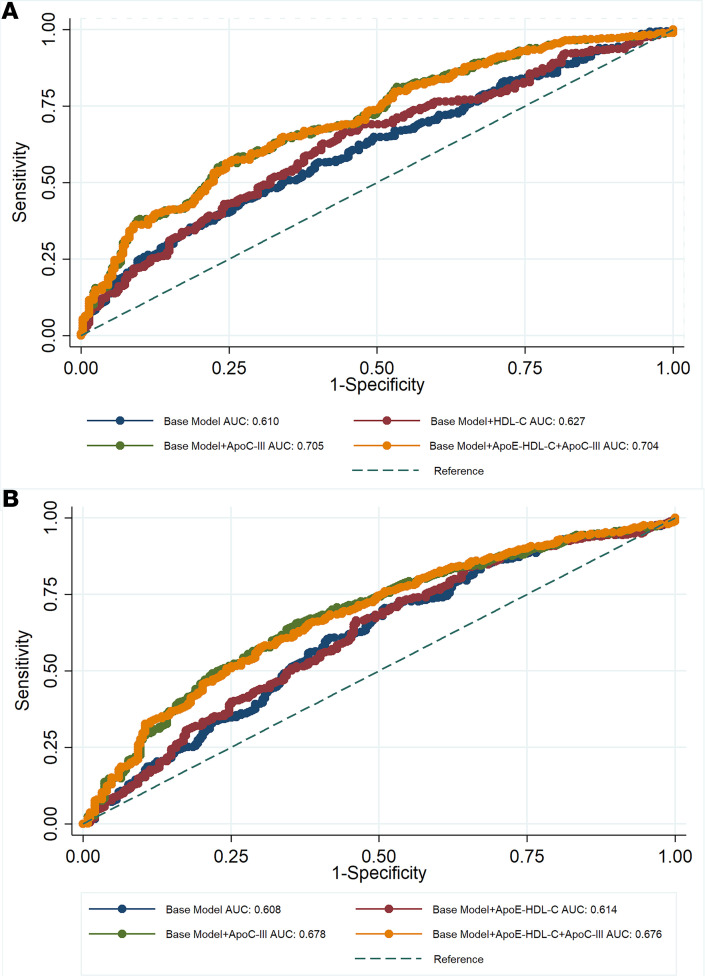
Figure 1. Results comparing logistic regression models with AUC ROCs were reported.
Pearson’s χ2 test was applied for estimating P values with significance level of P < 0.05. Predicting of CAD based on CCTA plaque parameters in (A) fibrous plaque burden (P = 0.0001) and (B) necrotic burden (P = 0.01). Base model includes age, sex, current smoking, BMI, statin treatment, hsCRP, LDL-C, and TGs. Hs(CRP), high-sensitivity C-reactive protein.

