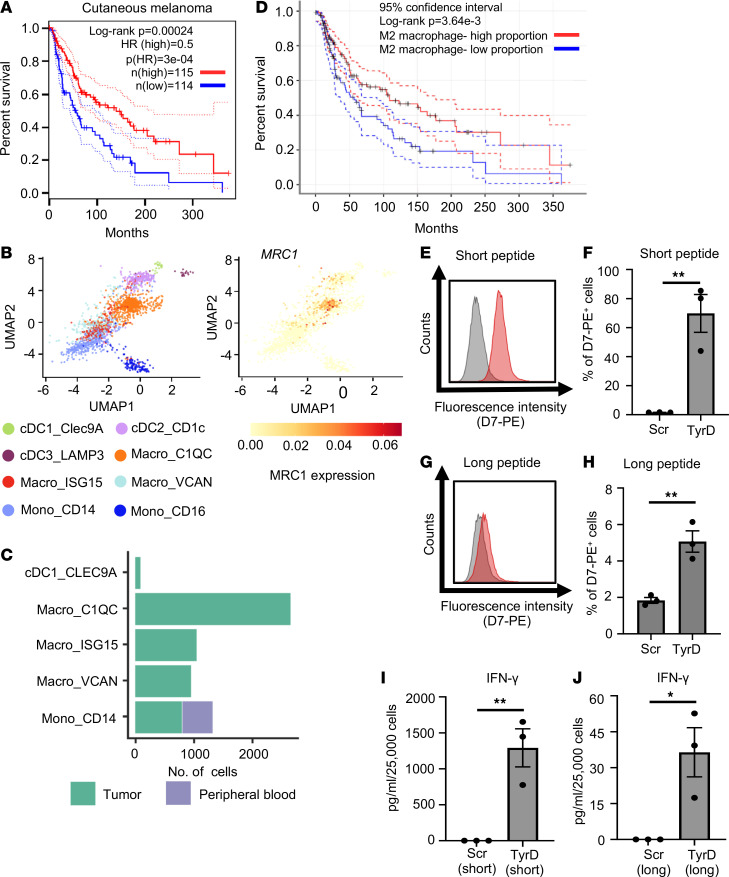
Figure 1. CD206+ TAM are detected in human melanoma tumors and can cross-present soluble TAA in vitro.
(A) Overall survival analysis based on MRC1 expression (blue, low MRC1 TPM; red, high MRC1 TPM) in cutaneous melanoma patients (n = 229) from the TCGA database, performed using GEPIA. (B) UMAP plots showing myeloid cell populations in melanoma colored by clusters (left) and expression of MRC1 (CD206) for cell type annotation (right). (C) Bar diagram represents number of cells per indicated subsets between tumor tissue (green) and peripheral blood (violet) in melanoma patients. (B and C) The data are generated using scDVA tool. (D) Overall survival analysis based on proportion of M2 macrophage in tumor tissue (blue, low M2 macrophage proportion; red, high M2 macrophage proportion) in cutaneous melanoma patients (n = 469) from TCGA database. (A and D) Long-rank test. (E) Detection of TyrD369–377/MHC I complex with D7 TCRL antibody on in vitro–generated TAM. TAM were pretreated with TyrD short peptide (red histogram) or Scr short peptide (gray histograms). Data are representatives of 3 donors. (F) Bar diagram represents percentage of positive cells, as detected by reactivity profile of D7 antibody upon treatment of in vitro–generated TAM with short Scr peptide or TyrD peptide. (G) As in E, but cells were treated with Scr long peptide (gray histogram) or TyrD long peptide (red histogram). (H) As in F, but cells were treated with long Scr or TyrD peptide. (I and J) Bar diagrams represent IFN-γ levels in the T58/TAM coculture supernatant, where in vitro–generated TAM were pretreated with short Scr or TyrD peptide (I) and where in vitro–generated TAM were pretreated with long Scr or TyrD peptide (J). (F and H–J) Data show mean ± SEM (n = 3 donors). Unpaired Student’ t test was used. *P < 0.05, **P < 0.01.

