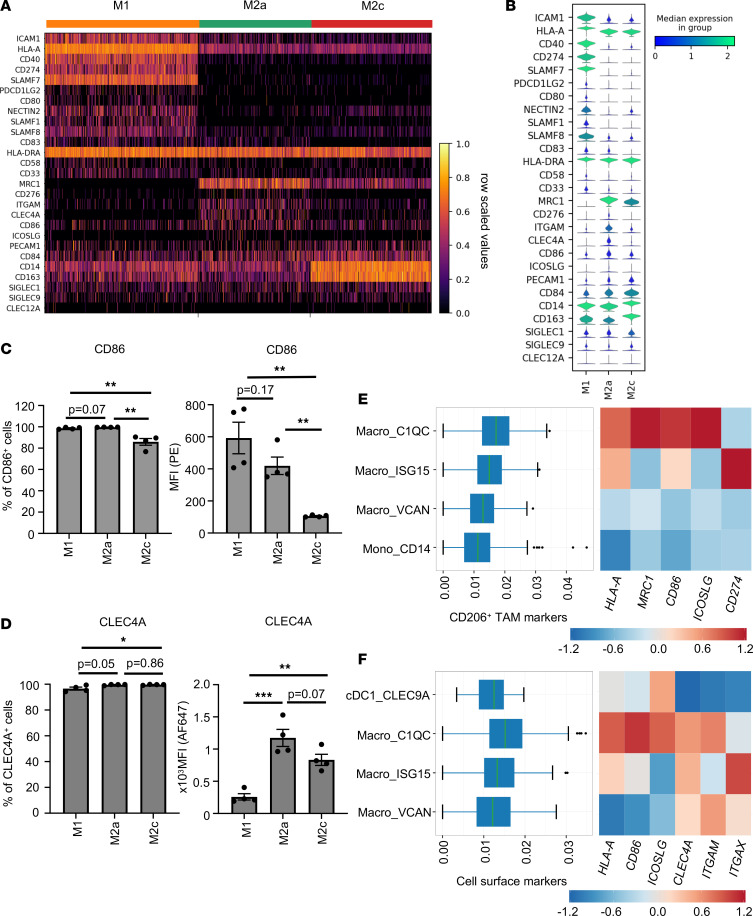
Figure 7. CD206+ macrophages express a unique cell surface repertoire.
(A) Heatmap showing scaled gene expression for selected genes derived from scRNA-Seq macrophage clusters M1, M2a, and M2c. Columns represent individual cells. Color scheme is based on row scaled values from minimum expression value as 0 (black) to maximum expression as 1 (yellow). (B) Corresponding violin plots illustrate expression distribution of selected genes on the y axis across indicated MDM subsets on the x axis. The violin plot color represents the median log normalized expression value from minimum value as 0 (blue) to maximum expression value as 2 (green). (C and D) Bar diagrams show percentage of CD86+ cells (C) and CLEC4A+ cells (D) with corresponding MFI as analyzed by flow cytometry. Data show mean ± SEM (n = 4 donors). Unpaired Student’s t test, followed by Holm-Šídák test for multiple comparisons, was performed. *P < 0.05, **P < 0.01, ***P < 0.001. (E and F) The box plot indicates the expression levels of indicated marker genes per cell, displaying the variation of cells in each group (left). Heatmap of Z scored median expression of indicated genes per group (right). Color scheme is based on Z scored median expression. Minimum expression value as –1.2 (blue) to maximum expression as +1.2 (red). The analysis was performed using scDVA tool.

