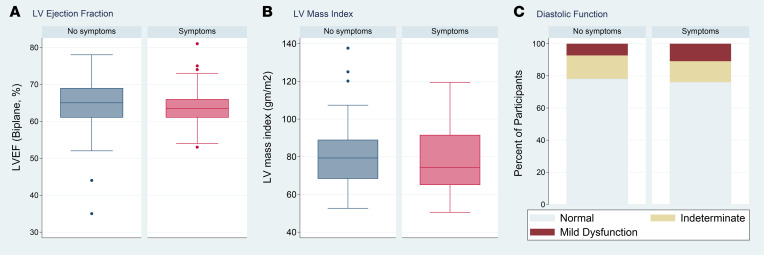
Figure 2. Left ventricular ejection fraction, left ventricular mass index, and diastolic function by cardiopulmonary symptoms.
(A) Box plot of left ventricular (LV) ejection fraction (LVEF) by symptoms, (B) box plot of LV mass index by symptoms, and (C) diastolic function by symptoms (n = 101, 99, and 101, respectively). Odds of symptoms were 1.16 times higher per 5% decrease in LVEF, which was not statistically significant (95% CI, 0.83–1.62; P = 0.40). The odds of symptoms were not significantly higher with increased LV mass (1.01 per 5 g/m2; 95% CI, 0.89–1.16; P = 0.81). With regards to diastolic function, 7% of those without symptoms and 11% with symptoms had mild diastolic dysfunction; the odds of symptoms were 1.77 times higher among those with diastolic dysfunction compared with those with normal diastolic function, which was not statistically significant but could not exclude a meaningful effect (95% CI, 0.35–8.88; P = 0.78), especially because there were no participants with more than mild diastolic dysfunction. In A and B, boxes represent the 25th and 75th percentile, the lines inside the boxes represent medians, whiskers represent the upper and lower adjacent values (3/2 times the IQR from the end of the box) as defined by Tukey, and dots represent outliers outside the whiskers.

