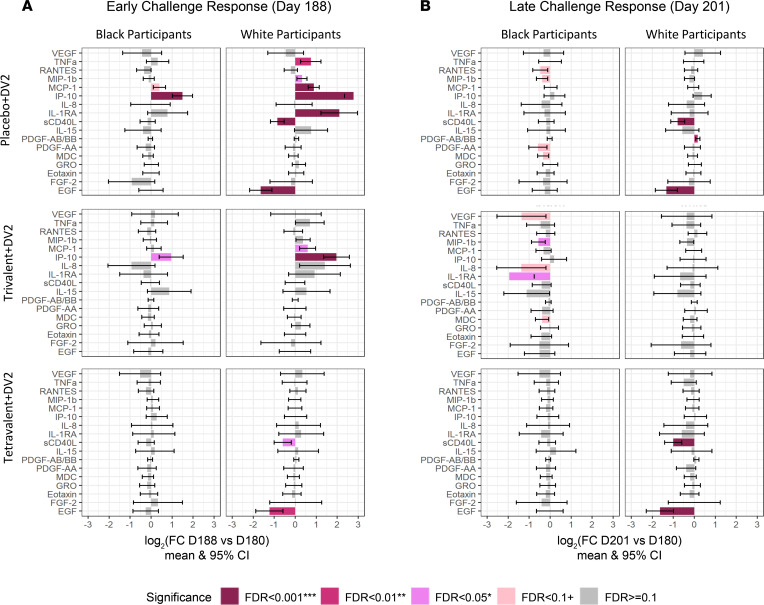
Figure 6. Bar plots showing cytokine response after challenge.
(A) Early challenge response: day 188 vs. day 180. (B) Later challenge response: day 201 vs. day 180. Mixed-effects model in the limma framework was used, with age and sex as fixed effects covariates as well as interaction time by race and by vaccine group and a random intercept for each participant. The adjusted P value is shown as FDR ≥ 0.01 (gray), FDR < 0.01 (light pink), FDR < 0.05 (pink), FDR < 0.01 (dark pink), and FDR < 0.001 (dark red).

