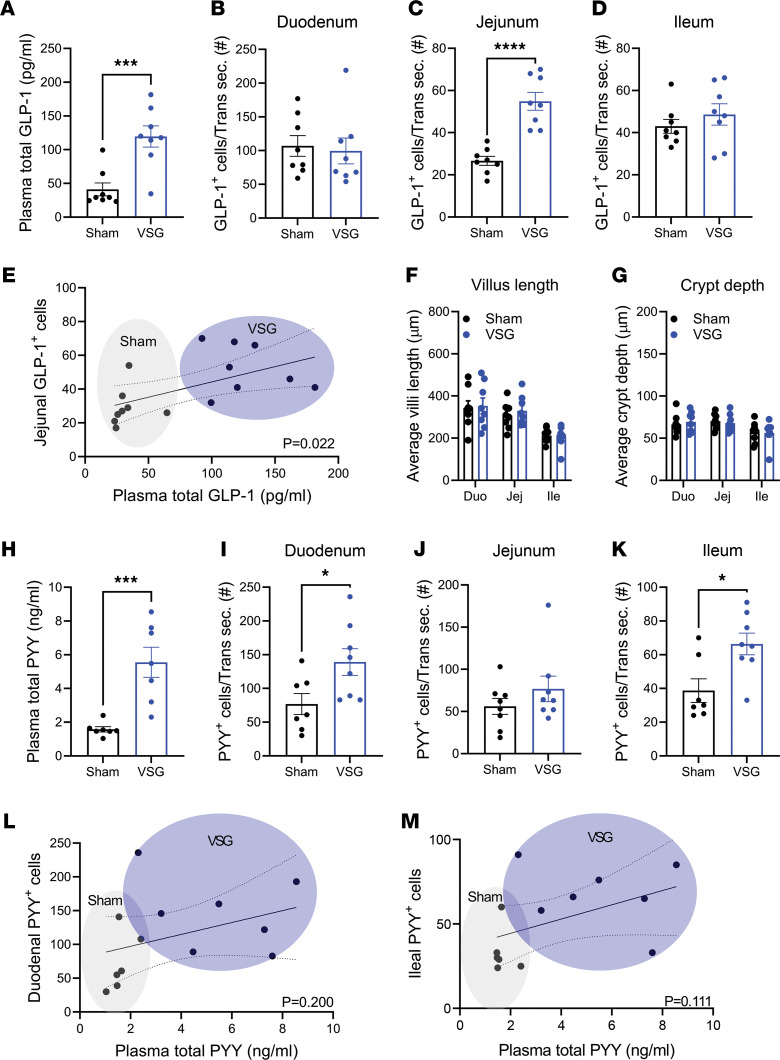
Figure 2. VSG increases plasma levels and EEC number of GLP-1 and PYY.
(A) Plasma total GLP-1 levels 15 minutes after a mixed liquid meal in sham or VSG-treated mice. (B–D) GLP-1+ EEC number of intestinal transverse sections (Trans sec.) of the duodenum (B), jejunum (C), or ileum (D). (E) Linear regression analysis of the jejunal GLP-1+ cell number versus plasma total GLP-1 level. (F and G) The villi length (F) and crypt depth (G) of the intestinal segments. (H) Plasma total PYY levels at 15 minutes after a liquid mixed meal administration in sham or VSG-treated mice. (I–K) PYY+ EEC number of the intestinal transverse sections of the duodenum (I), jejunum (J), or ileum (K). (L and M) Linear regression analysis of the duodenal (L) or ileal (M) PYY+ cell number versus plasma total PYY level. Mean ± SEM. Statistics, t test or ANOVA. *P < 0.05, ****P < 0.0001, n = 8.

