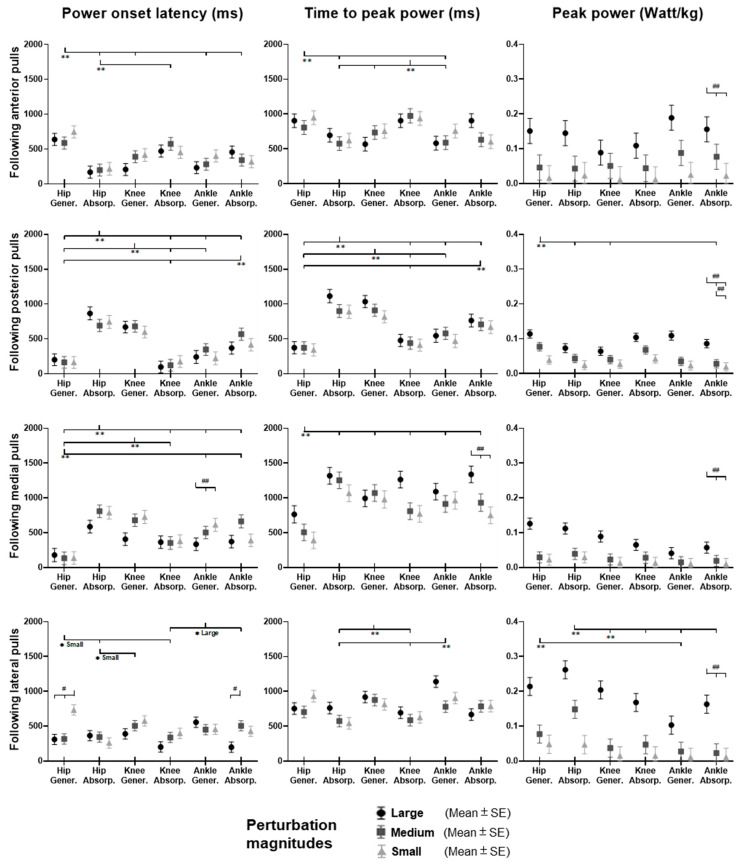
Figure 8.
The power onset latencies, time to peak power, and peak power responses in lower-limb joints following unexpected horizontal perturbations (mean ± SE, n = 12). (Note: Gener.: power generation; Absorp.: power absorption; SE: standard error;  or
or  : pairwise comparison. Significant differences in post hoc pairwise comparisons (p < 0.05) were indicated by the: ** for the main effect of joint motion factor; * for the simple main effect of joint motion factor; ## for the main effect of magnitude factor; # for the simple main effect of magnitude factor).

