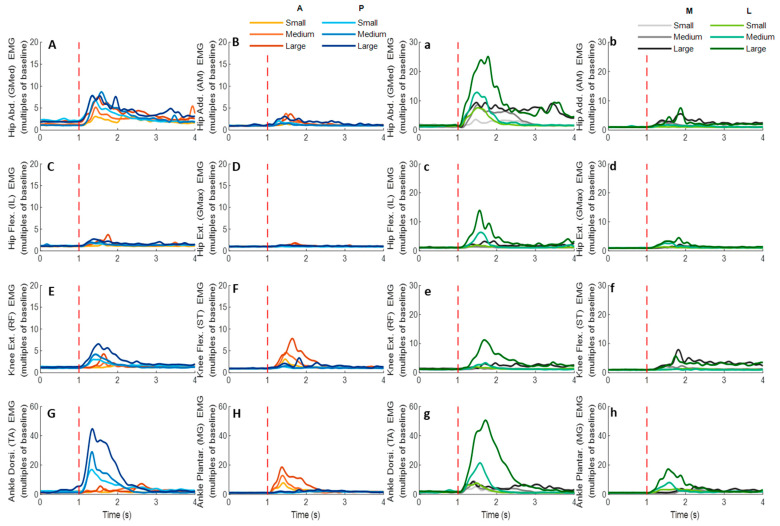
Figure 12.
The mean EMG signal changes of twelve participants for eight dominant-leg muscles following the unexpected anterior, posterior, medial, and lateral perturbations with three magnitudes (n = 12). Mean EMG signal changes for hip abductor-adductor (A,B), hip flexor-extensor (C,D), knee extensor-flexor (E,F), and ankle dorsiflexor-plantarflexor (G,H) following anterior and posterior perturbations; Mean EMG signal changes of hip abductor-adductor (a,b), hip flexor-extensor (c,d), knee extensor-flexor (e,f), and ankle dorsiflexor-plantarflexor (g,h) following medial and lateral perturbations. (Note: The EMG amplitude values were multiples of the 1000-ms baseline mean value before a pulling perturbation. The red dotted line indicated the start of pulling perturbation. EMG: electromyography. GMed: gluteus medius; AM: adductor magus; IL: iliopsoas; GMax: gluteus maximus; RF: rectus femoris; ST: semitendinosus; TA: tibialis anterior; MG: gastrocnemius medialis; A: anterior; P: posterior; M: medial; L: lateral).

