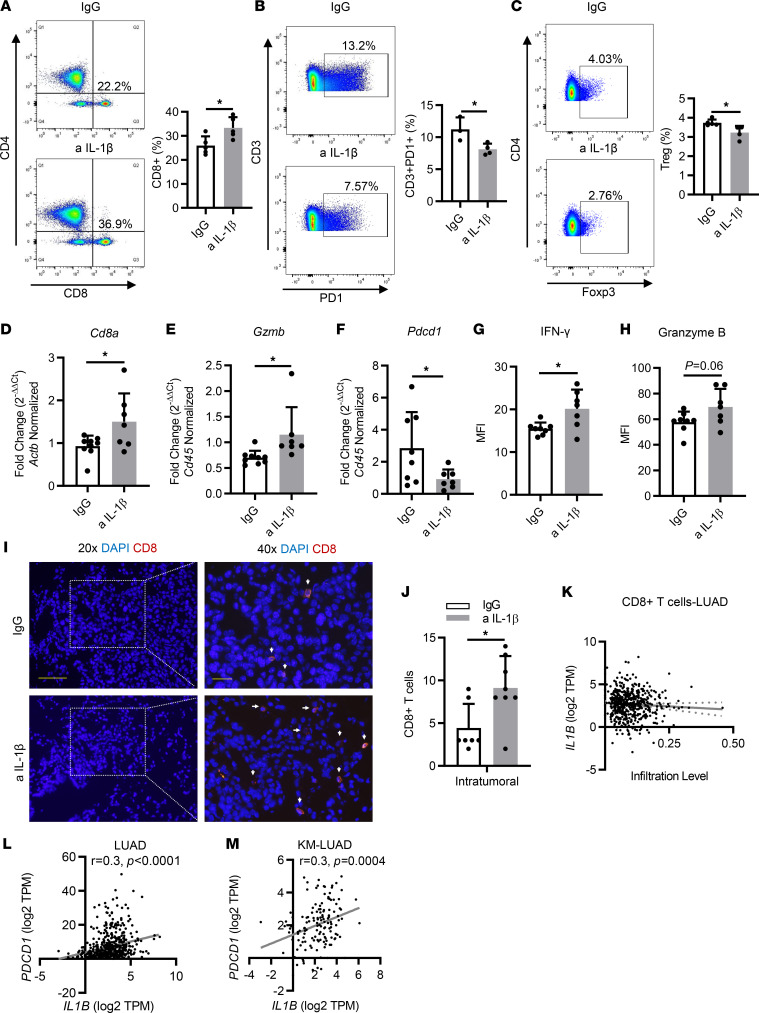
Figure 3. Immunopreventive blockade of IL-1β modulates the TME to an antitumor immune phenotype.
(A) Representative flow cytometry analysis of CD8+ T cells and percentage of CD8+ T cells in the whole lung (n = 5). (B) Representative flow cytometry analysis of CD3+ programmed cell death 1–positive (PD-1+) T cells and percentage of CD3+PD-1+ T cells in the whole lung (n = 3–4). (C) Representative flow cytometry analysis of regulatory Tregs and percentage of Tregs in the whole lung (n = 4–5). (D–F) Relative mRNA expression of (D) Cd8a, (E) Gzmb, and (F) Pdcd1 in the whole lung, normalized to Cd45 or Actb expression (n = 7–9). (G and H) MFI of (G) IFN-γ and (H) granzyme B measured by multiplex ELISA in IgG or anti–IL-1β Ab–treated mice (n = 7–8). (I) Representative photomicrographs and (J) quantification of IF staining with anti-CD8a (red) and DAPI (blue) in tumor lesions (left top and bottom: original magnification, ×20, scale bar: 50 μm; right top and bottom: ×40, scale bar: 20 μm.) n = 7–8. (K) Correlation between IL1B expression and infiltration of CD8+ T cells in LUAD (n = 535). (L) Correlation between IL1B expression and PDCD1 expression in LUAD (n = 535). (M) Correlation between IL1B expression and PDCD1 expression in KM-LUAD (n = 139). Data represent mean ± SEM. *P < 0.5 by unpaired t test. a IL-1β, anti–IL-1β; TPM, transcript count per million.

