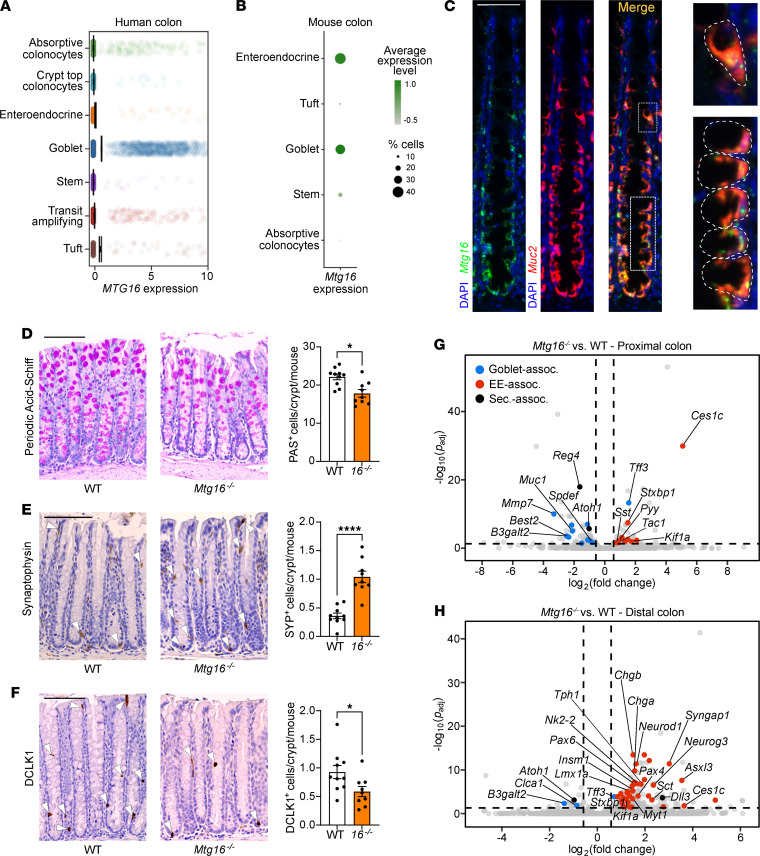
Figure 1. MTG16 is expressed in colonic secretory cells, and its deficiency alters secretory lineage allocation.
(A) MTG16 expression in cell populations generated from scRNA-Seq of normal human colon biopsies (discovery cohort, n = 35 samples, 30,374 cells) (validation cohort, Supplemental Figure 1A). (B) Mtg16 expression in scRNA-Seq of WT mouse colon (n = 3 mice, 3653 cells). Color gradient represents average Mtg16 expression level in each cell population. Dot size represents percentage of cells in each population expressing Mtg16. Uniform manifold approximation and projection plots are in Supplemental Figure 1B. (C) RNAscope in situ hybridization of Mtg16 and Muc2 in WT mouse colon. Scale bar = 50 μm. Goblet cells are outlined in the insets at right. (D–F) WT and Mtg16–/– mouse colon (n = 10 WT, 9 Mtg16–/–) stained for (D) goblet cells by PAS stain, (E) enteroendocrine cells by IHC for SYP, and (F) tuft cells by IHC for doublecortin-like kinase 1 (DCLK1). Representative images at left. SYP+ and DCLK1+ cells are indicated with white arrowheads. Scale bars = 100 μm. *P < 0.05, ****P < 0.0001, 2-tailed Mann-Whitney U test. (G and H) Volcano plots demonstrating differentially expressed genes in (G) proximal (n = 2 WT, 2 Mtg16–/–) and (H) distal (n = 4 WT, 4 Mtg16–/–) colonic epithelial isolates by RNA-Seq. Horizontal dashed line, Padj < 0.05 by DESeq2. Vertical dashed lines, fold change = 1.5. Dot colors: goblet-associated (blue), enteroendocrine-associated (EE-associated) (red), and secretory-associated (black) genes.

