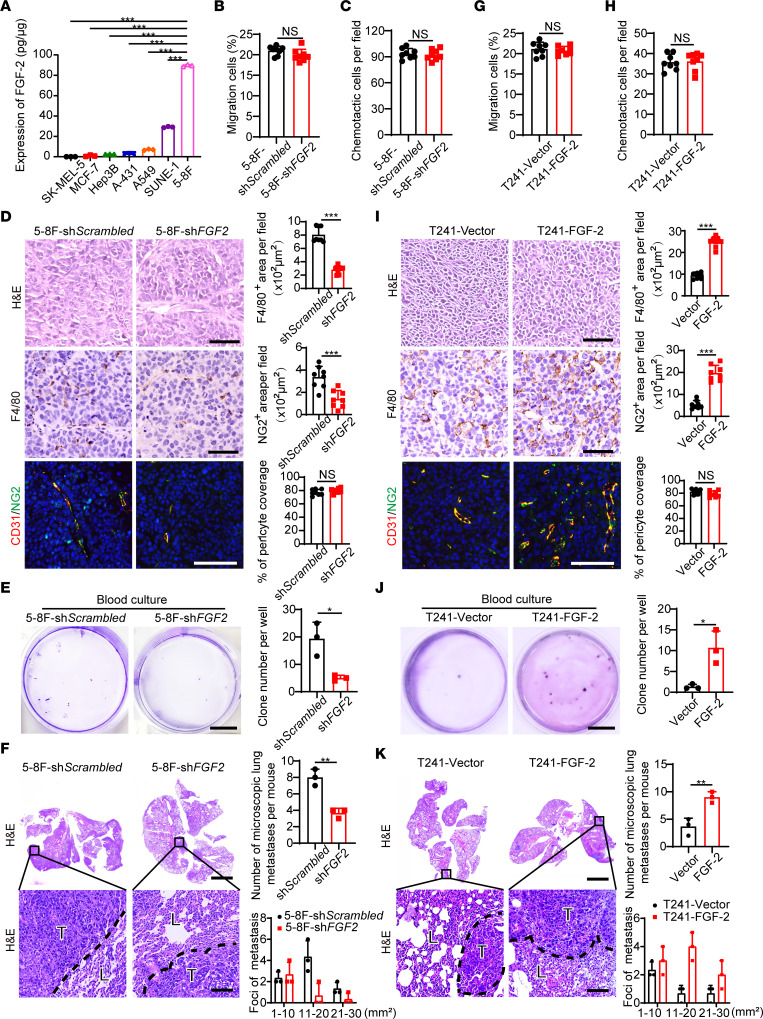
Figure 2. FGF-2 promotes TAM infiltration and tumor metastasis in mice.
(A) FGF-2 protein expression levels in various human tumor cell lines, including SK-MEL-5 melanoma, MCF-7 breast cancer, Hep3B hepatocellular carcinoma, A-431 squamous cell carcinoma, A549 lung cancer, SUNE-1 NPC, and 5-8F NPC (n = 3 samples per group). (B, C, G, and H) Migration and chemotactic ability of scrambled and FGF2 shRNA–transfected NPC cancer cells (B and C) and of vector and FGF-2 overexpressing T241 tumor cells (G and H). (D and I) Xenograft tumor tissues were stained with H&E, an anti-F4/80 antibody (brown), an anti-CD31 antibody, and an anti-NG2 antibody (n = 8 mice per group). Scale bar in upper panel: 50 μm. Scale bar in middle panel: 50 μm. Scale bar in lower panel: 100 μm. Quantification of F4/80+ signals, NG2+ signals, and coverage rate of NG2+ pericytes (n = 8 random fields per group). (E and J) Micrographs of representative cell culture dishes after incubation with blood samples from 5-8F shScrambled or 5-8F shFGF2 tumor–bearing mice (E) and from vector or FGF-2–overexpressing tumor–bearing mice (J). Blue signal indicates the crystal violet–positive tumor colonies. Scale bar: 1 cm (n = 3 samples randomly chosen from 8 mice per group). (F and K) H&E staining in the lung from 5-8F shScrambled or 5-8F shFGF2 tumor–bearing mice (F) and from vector or FGF-2–overexpressing tumor–bearing mice (K). Scale bar in upper panel: 3 mm. Scale bar in lower panel: 100 μm. Quantification of total microscopic lung metastases and various sizes of metastases (n = 3 samples randomly chosen from 8 mice per group). *P < 0.05, **P < 0.01, ***P < 0.001 by unpaired 2-tailed Student’s t test (B–K) or 1-way ANOVA with Tukey’s multiple-comparison analysis (A). Data are presented as mean ± SD.

