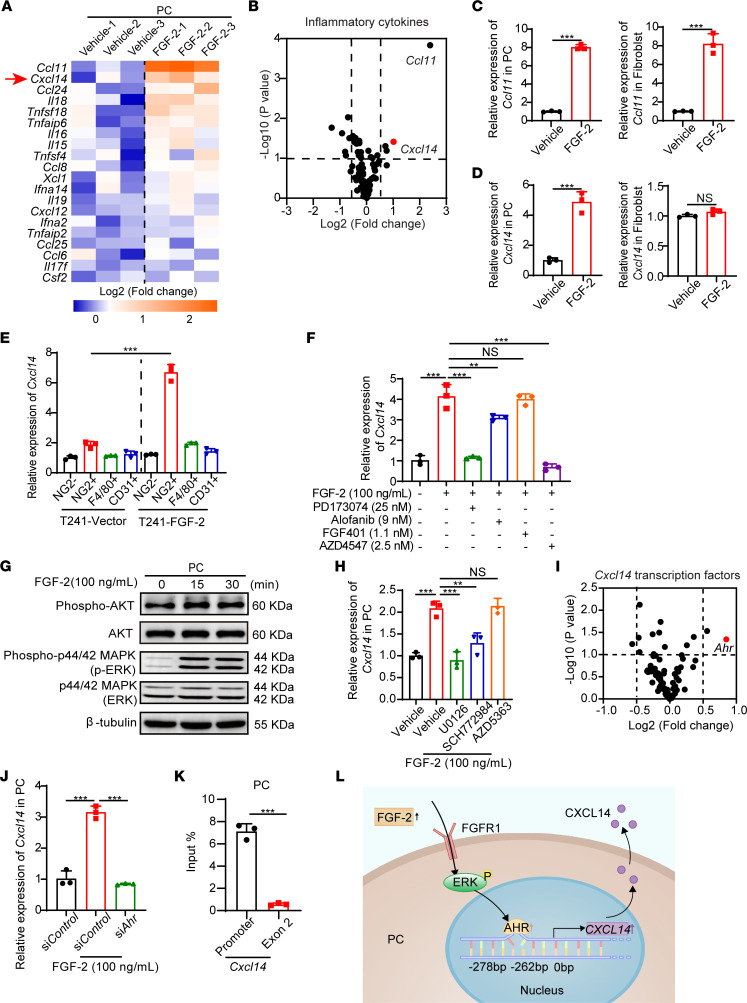
Figure 4. FGF-2 induces CXCL14 expression in pericytes via FGFR1/ERK/AHR signaling.
(A) Heatmap of selected genes by inflammatory cytokine/chemokine profiling of vehicle- and FGF-2–treated primary mouse pericytes (n = 3 samples per group). Arrow points to upregulated Cxcl14 gene. (B) Volcano plot of inflammatory gene profiling of vehicle- and FGF-2–stimulated pericytes (n = 3 samples per group). (C and D) Expression levels of Ccl11 and Cxcl14 in vehicle- and FGF-2–stimulated isolated primary pericytes and MS5 fibroblasts (n = 3 samples per group). (E) qPCR quantification of Cxcl14 mRNA levels in F4/80+ TAMs, NG2+ pericytes, CD31+ endothelial cells, and NG2– population isolated from T241-vector and T241–FGF-2 tumors (n = 3 samples per group). (F) qPCR quantification of Cxcl14 mRNA levels in vehicle- and FGF-2–stimulated pericytes in the presence or absence of FGFR1, FGFR2, and FGFR3 specific inhibitors, and pan-FGFR inhibitor (n = 3 samples per group). (G) After 0, 15, 30 minutes of stimulation, FGF-2 induced phosphorylation of AKT and ERK in pericytes. β-Tubulin marks the loading level in each lane. These experiments were repeated twice. (H) qPCR quantification of Cxcl14 mRNA levels in vehicle- and FGF-2–stimulated pericytes in the presence or absence of MEK1/2, ERK1/2, and AKT specific inhibitors (n = 3 samples per group). (I) Volcano plot of predicted transcription factors which bind to Cxcl14 promoter in genome-wide expression profiling of vehicle- and FGF-2–stimulated pericytes (n = 3 samples per group). (J) qPCR quantification of Cxcl14 mRNA levels in vehicle- and FGF-2–stimulated pericytes in the presence or absence of Control or Ahr-specific siRNA (n = 3 samples per group). (K) ChIP assay of AHR binding to the Cxcl14 gene promoter. Nonimmune IgG and Cxcl14 exon 2 regions served as controls (n = 3 samples per group). (L) Mechanistic diagram of the FGF-2/FGFR1/ERK/AHR/CXCL14 signaling pathway. **P < 0.01, ***P < 0.001 by unpaired 2-tailed Student’s t test (C–E and K) or 1-way ANOVA with Tukey’s multiple-comparison analysis (F, H, and J). Data are presented as mean ± SD.

