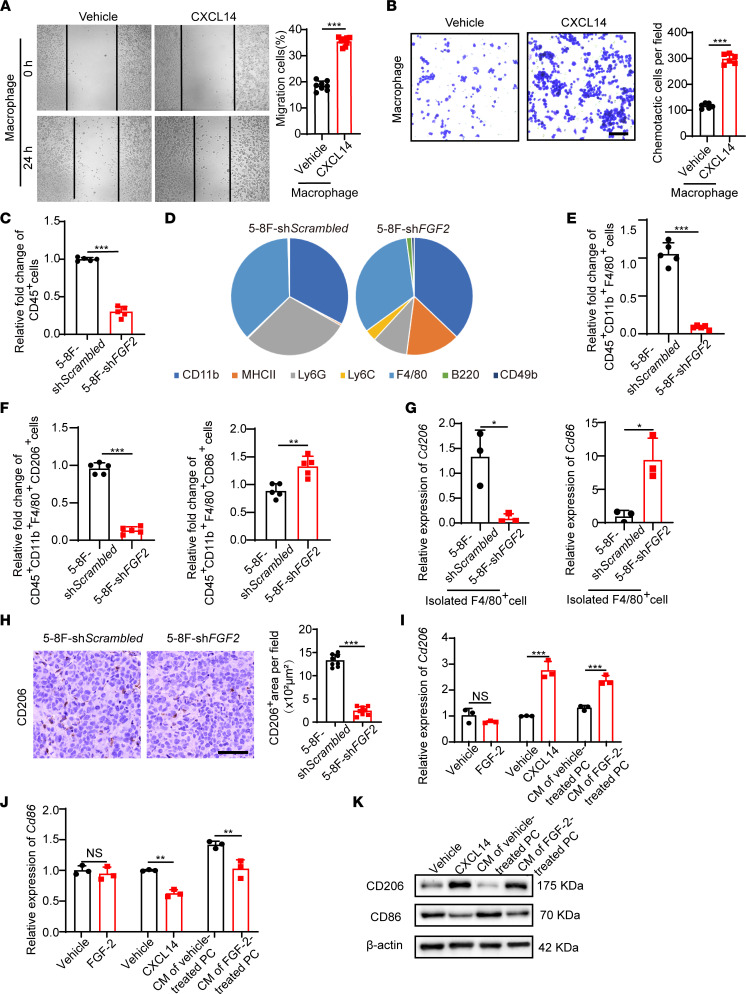
Figure 5. CXCL14 recruits, activates, and polarizes TAMs.
(A and B) Mouse macrophage migration (n = 8 samples per group) and chemotactic ability (n = 6 samples per group) of macrophage treated with or without CXCL14. (C) Quantification of CD45+ cells in xenograft shScrambled- and shFGF2-transfected NPC tumors (n = 5 samples per group). (D) Pie charts of percentage of various inflammatory cells in xenograft shScrambled- and shFGF2-transfected NPC tumors (n = 5 samples per group). CD45+CD11b+F4/80+ macrophage population, CD45+MHCII+CD11b+CD11c+ DC population, CD45+CD11b+Ly6GhiLy6Cint granulocytic subsets of myeloid-derived suppressor cell population, CD45+CD11b+Ly6G–Ly6C+ monocytic subsets of myeloid-derived suppressor cell population, CD45+B220+ B cell population, and CD45+CD11b–CD49b+ NK cell population were analyzed. (E and F) Quantification of CD45+CD11b+F4/80+ TAM population, CD45+CD11b+ F4/80+CD206+ M2-like TAM population, and CD45+CD11b+F4/80+CD86+ M1-like TAM population (n = 5 sample per group). (G) qPCR quantification of CD206 and CD86 mRNA levels in F4/80+ TAMs isolated from xenograft shScrambled- and shFGF2-transfected NPC tumors (n = 3 samples per group). (H) Tumor tissues were stained with an anti-CD206 antibody (brown). Scale bar: 50 μm. Quantification of CD206+ signals (n = 8 random fields per group). (I and J) qPCR quantification of CD206 and CD86 mRNA levels in macrophages that were activated with FGF-2–treated pericyte conditioned medium or CXCL14. Vehicle- and FGF-2–stimulated macrophages serve as controls (n = 3 samples per group). (K) CXCL14- or FGF-2–treated pericyte conditioned medium–induced CD206 upregulation and CD86 downregulation in macrophages. β-Actin marks the loading level in each lane. These experiments were repeated twice. *P < 0.05, **P < 0.01, ***P < 0.001 by unpaired 2-tailed Student’s t test (A–C and E–J). Data are presented as mean ± SD.

