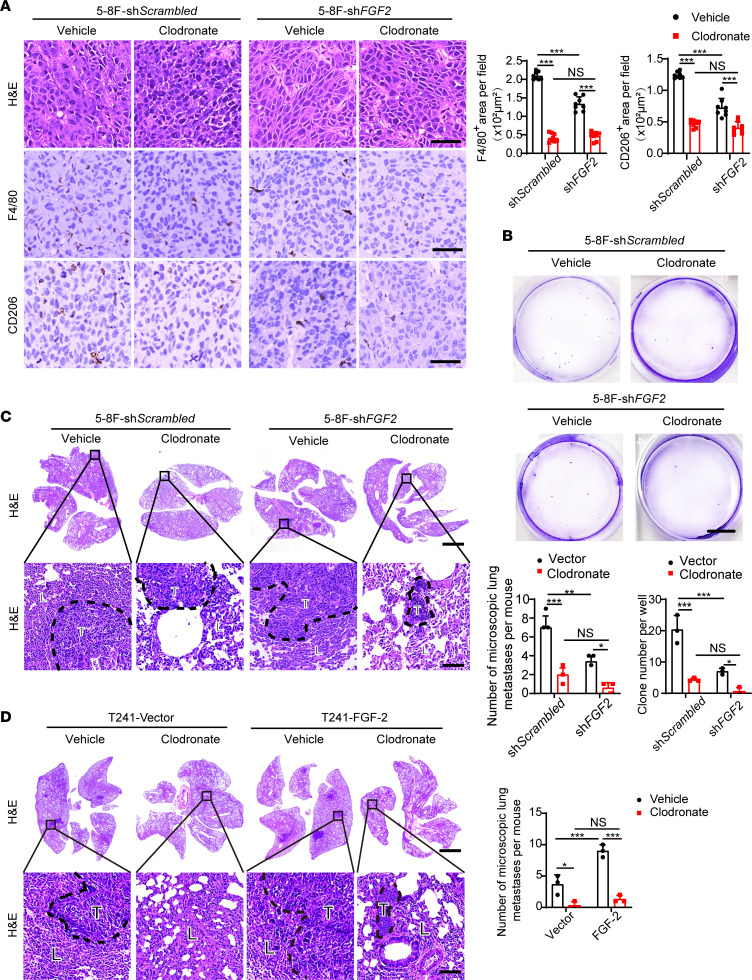
Figure 7. Pharmacological TAM depletion diminishes FGF-2–induced NPC metastasis.
(A) Micrographs of H&E and IHC staining with F4/80 (brown) or CD206 (brown) in 5-8F shScrambled or 5-8F shFGF2 tumors implanted in clodronate-treated and nontreated mice. Scale bar: 50 μm. Quantification of F4/80+ and CD206+ signals (n = 8 random fields per group). (B) Micrographs of representative cell culture dishes after incubation with blood samples from 5-8F shScrambled or 5-8F shFGF2 tumor–bearing mice receiving vehicle or clodronate liposomes. Blue signal indicates the crystal violet-positive tumor colonies. Scale bar: 1 cm. (C) H&E staining in the lung from 5-8F shScrambled or 5-8F shFGF2 tumor–bearing mice. Scale bar in upper panel: 3 mm. Scale bar in lower panel: 100 μm. Quantification of total microscopic lung metastases and various sizes of metastases (n = 3 samples randomly chosen from 6 mice per group). (D) H&E staining in the lung from vector or FGF-2–overexpressing tumor–bearing mice. Scale bar in upper panel: 3 mm. Scale bar in lower panel: 100 μm. Quantification of total microscopic lung metastases and various sizes of metastases (n = 3 samples randomly chosen from 6 mice per group). **P < 0.01, ***P < 0.001 by 1-way ANOVA with Tukey’s multiple-comparison analysis (A–D). Data are presented as mean ± SD.

