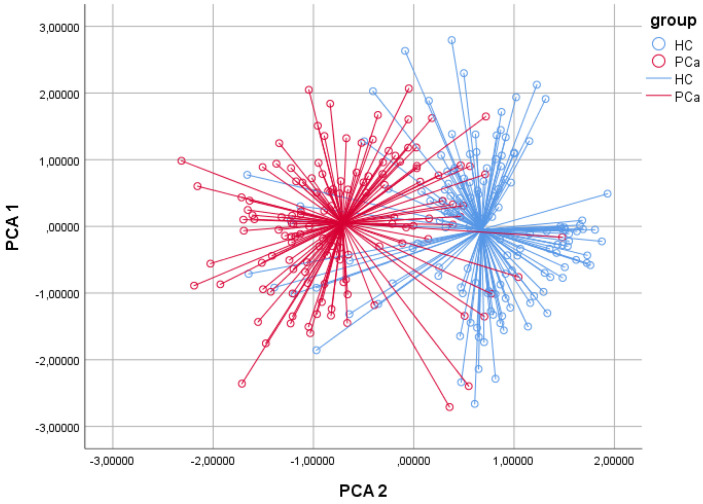
Figure 1.
Two-dimensional principal component analysis plot. The two-dimensional PCA plot showed that patients with prostate cancer could be distinguished from healthy controls. Results obtained with CDA demonstrated correct classification in 85.3% of cases (p < 0.001). In ROC analysis, discrimination accuracy between PCa patients and healthy controls was 0.90. Repeated analysis using the second measure of each collected urine sample provided comparable findings. Sensitivity and specificity were 83.1% and 87.6%, respectively.

