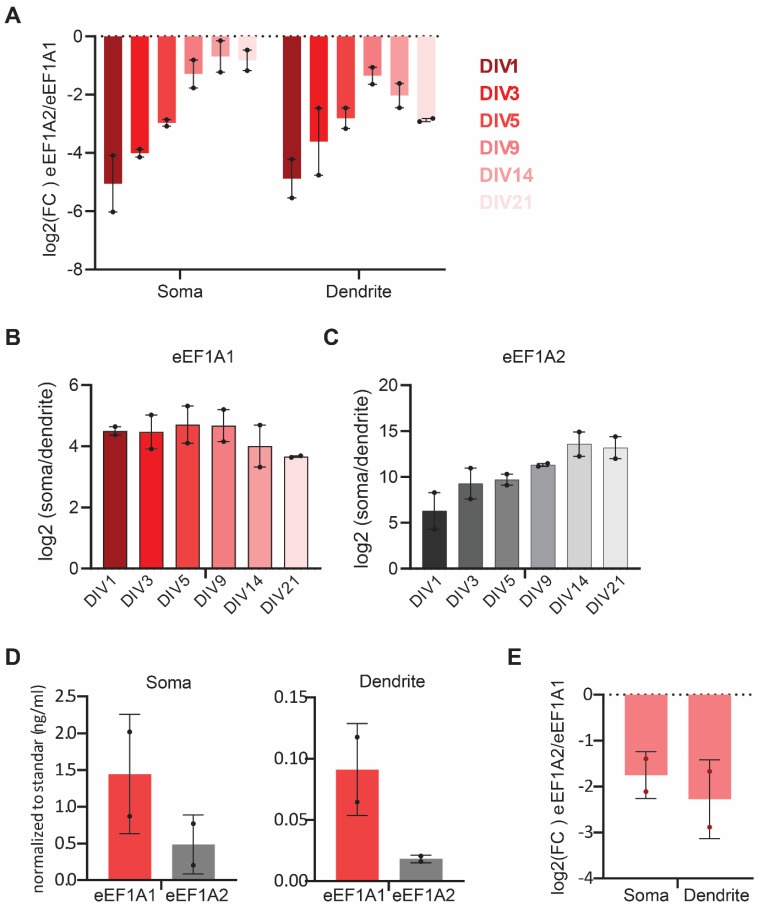
Figure 5.
Relation of eEF1A1 and eEF1A2 mRNA subcellular localization over neurodevelopment. (A) Fold change in the expression of eEF1A2 vs. eEF1A1. Plot of the log2 of the ratio between eEF1A2 and eEF1A1 mRNA molecule density at the indicated DIVs in somas and in dendrites from experiments quantified in Figure 2 and Figure 3. (B,C) Fold change in the somatic versus the dendritic number of eEF1A1 (B) and eEF1A2 (C) mRNAs at the indicated DIVs. (D) RT-QPCR to detect eEF1A1 and eEF1A2 mRNAs from total RNA extracted from the soma or neurite fractions of DIV21 neurons was normalized to a standard curve obtained from serial dilutions (50, 5, 0.5, and 0.05 ng/mL) of total cDNA. Average and SD of two biological replicas. (E) Plot of the log2 of the ratio between eEF1A2 and eEF1A1 mRNA relative concentrations in somas and dendrites obtained from (D).

