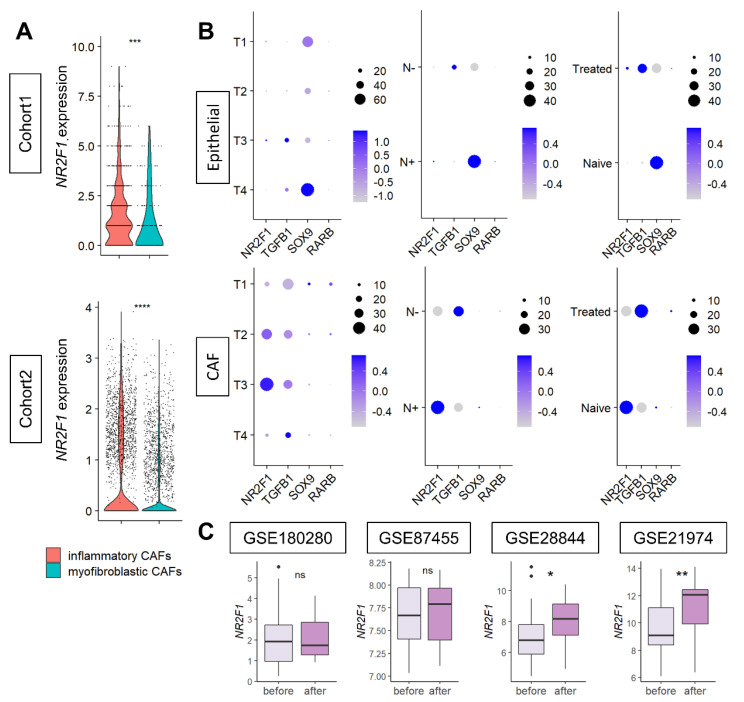
Figure 7.
(A) Violin plots showing NR2F1 expression of inflammatory CAF (iCAF) and myofibroblastic CAF (myCAF) of the two single−cell cohorts. One dot represents one cell. One−way ANOVA test was performed, and *** indicates p ≤ 0.001. (B) Dot plots showing NR2F1, TGFB1, SOX9, and RARB expressions in epithelial (cancer) cells and CAFs of single−cell Cohort 2 by T category of AJCC TNM staging, with and without lymph node metastasis, and with and without prior drug therapy. The size of each dot indicates the number of cells, and the purple intensity indicates the expression level. (C) Boxplots showing NR2F1 expression before and after neoadjuvant chemotherapy in the four cohorts. Mann–Whitney U test was used for analysis, and the symbols in the figure are as follows: ns, p > 0.05; *, p ≤ 0.05; **, p ≤ 0.01, ****, p ≤ 0.0001.

