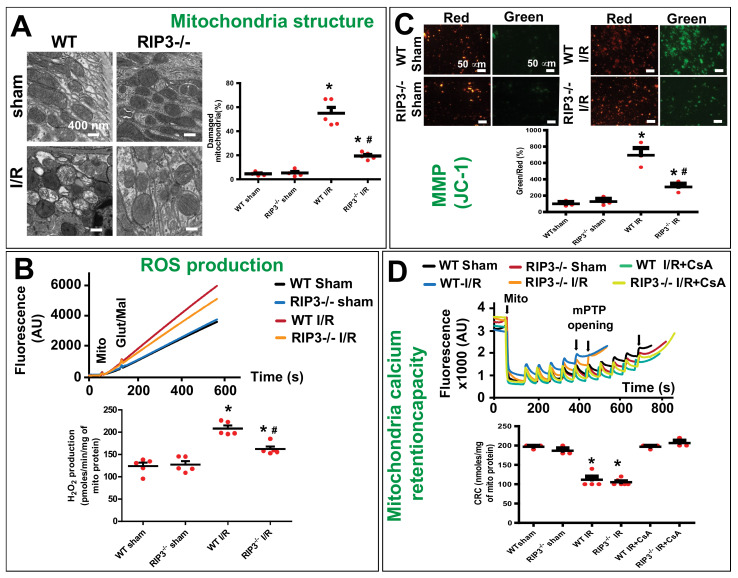
Figure 5.
RIP3 knockout protects against mitochondrial damage and dysfunction after renal I/R. (A) Electron microscopy images of mitochondria in kidney tissues showing a dramatic increase in cristae disruption after renal I/R compared to sham mitochondria in WT mice. However, in RIP3−/− mice, the level of cristae disruption was reduced when compared to littermate WT mice after renal I/R. Note that there was no difference in the levels of cristae disruption between WT and RIP3−/− sham mice. Bar graph showing percentage of damaged mitochondria in each group. Fragmented or disrupted cristae with empty spaces (in the matrix) were considered damaged mitochondria, while mitochondria with dense continuous cristae were considered as good or undamaged. A minimum of 100 mitochondria were counted in each group. Values are expressed as means ± SEM; * p <0.05 versus WT sham group, # p <0.05 versus WT-I/R group (n = 5/group). (B) Top: Recording of mitochondrial reactive oxygen species (ROS) production using Amplex red in the presence of horseradish peroxidase after stimulation of complex I with glutamate–malate. Bottom: Graph showing a dramatic increase in ROS production after renal I/R compared to sham group in WT mice mitochondria. However, in RIP3−/− mice, the ROS production was reduced when compared to littermate WT mice after renal I/R. Note that there was no difference in ROS production between WT and RIP3−/− sham mice. Values are expressed as means ± SEM; * p <0.05 versus WT sham group, # p <0.05 versus WT-I/R group (n = 4/group). (C) RIP3 knockout in mice protects the mitochondrial membrane potential as measured with the JC-1 dye stained in isolated mitochondria. Image (right) and graph (left) showing an increase in the green/red fluorescence intensity ratio (that indicate depolarization) in WT mitochondria after renal I/R compared to sham mitochondria. Note the reduction in the green/red fluorescence intensity ratio in RIP3−/− mice compared to WT mitochondria after renal I/R. Values are expressed as means ± SEM; * p <0.05 versus WT sham group, # p < 0.05 versus WT-I/R (n = 3/group). (D) RIP3 knockout in mice does not affect mitochondrial Ca2+ retention capacity (CRC) required to induce the mitochondrial permeability transition pore (mPTP) opening after renal I/R injury. Typical spectrofluorometric recordings of Ca2+ overload in mitochondria isolated from hearts after 60 min ischemia followed by 6 h reperfusion. Subsequently, 20 nmol-mg−1 of protein Ca2+ pulses was delivered until a spontaneous and massive release was observed, presumably to the opening of the mPTP (arrows). The graph shows no difference in mitochondrial CRC between WT and RIP3−/− mitochondria from the sham group after renal I/R and after renal I/R supplemented with cyclosporine A (mPTP opening inhibitor, 2 µM). Values are expressed as means ± SEM; * p < 0.05 versus WT sham group (n = 3/group).

