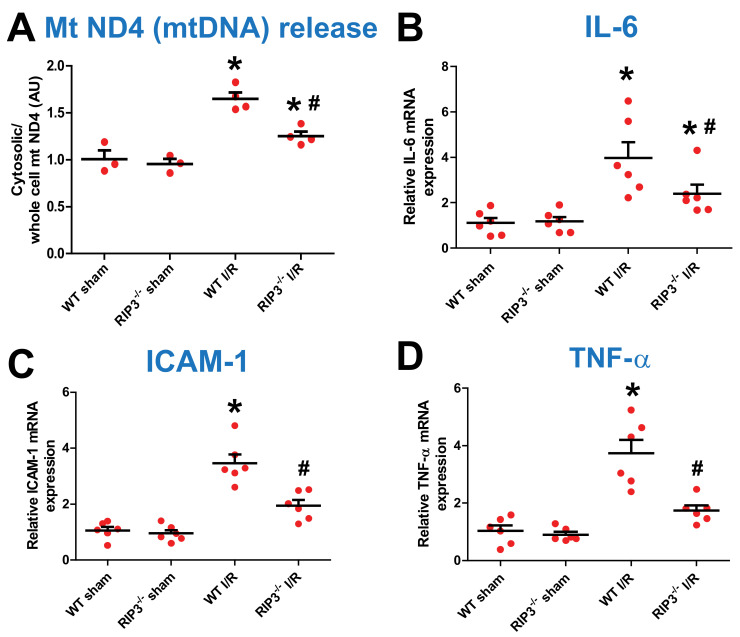
Figure 6.
RIP3−/− mice exhibit decreased mtDNA release and inflammation after renal I/R. (A) Graph showing an increase in mitochondrial DNA (mtDNA) release in the cytosol in WT mice after renal I/R compared with the sham-operated animals. However, in RIP3−/− mice, the release of mtDNA was reduced when compared to littermate WT mice after renal I/R. Note that there was no difference in mtDNA levels between WT and RIP3−/− sham mice. Values are expressed as means ± SEM; * p < 0.05 versus WT sham group, # p < 0.05 versus WT-I/R (n = 4/group). (B–D) Graph showing increases in pro-inflammatory markers including IL-6, ICAM-1, and TNF-6 levels in the cytosol in WT mice after renal I/R compared with the sham-operated animals. However, in RIP3−/− mice, the release of these pro-inflammatory markers was reduced when compared to littermate WT mice after renal I/R. Note that there was no difference in pro-inflammatory markers between WT and RIP3−/− sham mice. Values are expressed as means ± SEM; * p < 0.05 versus WT sham group, # p < 0.05 versus WT-I/R (n = 6/group).

