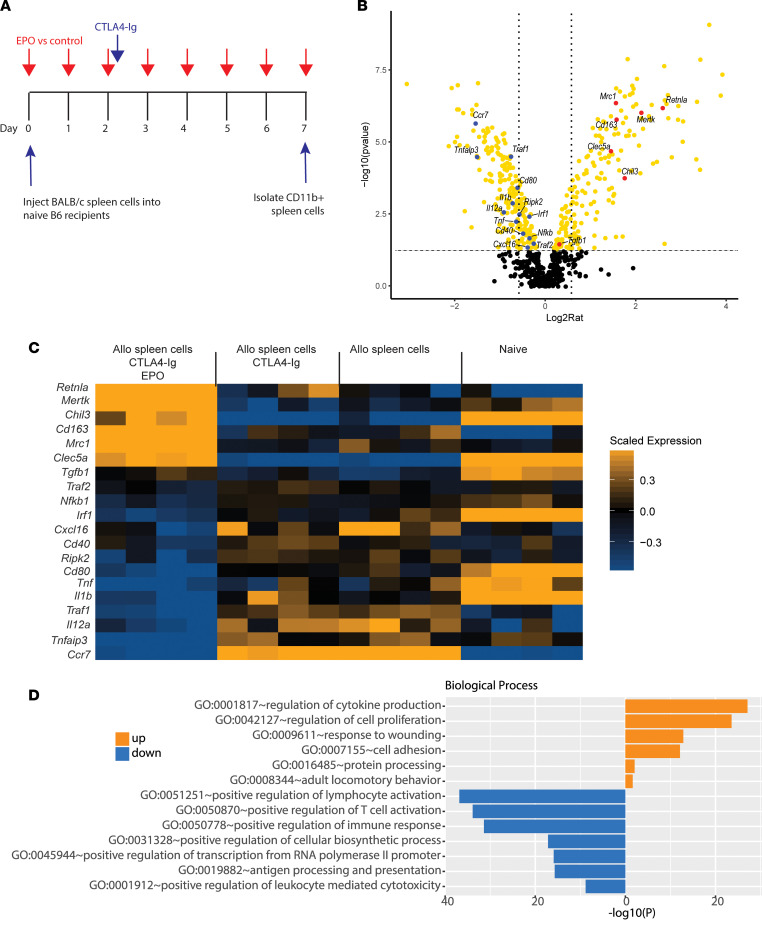
Figure 5. EPO alters monocyte gene expression profiles.
(A) Experimental design. (B) Volcano plot of NanoString gene expression depicting differentially expressed genes (yellow) by Limma test (upregulated to the right) for monocytes isolated from B6 mice injected with BALB/c spleen cells/CTLA4-Ig/EPO versus BALB/c spleen cells/CTLA4-Ig, n = 4/group. Selected upregulated or downregulated genes are annotated in red or blue, respectively; x axis fold-change, vertical lines drawn at 1.5-fold; y axis adjusted P value, horizontal line drawn at adjusted P value = 0.05. (C) Multigroup heatmap demonstration of key upregulated or downregulated genes. (D) Bar chart of significantly enriched biological processes of differentially upregulated or downregulated genes comparing BALB/c spleen cells/CTLA4-Ig/EPO with BALB/c spleen cells/CTLA4-Ig.

