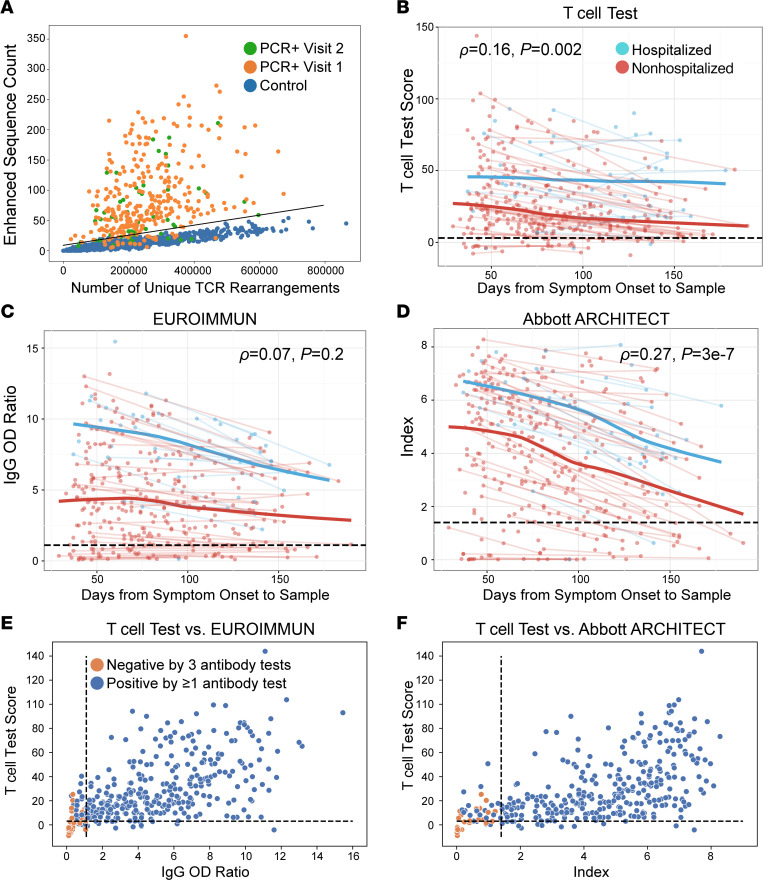
Figure 5. Comparison of TCR-based assay and serological assays.
(A) Number of SARS-CoV-2 enhanced sequences (of 4287 possible) verus number of unique TCR rearrangements for RT-PCR–confirmed samples collected at visit 1 (n = 302; orange) or visit 2 (n = 55; green) or control samples (n = 1657; blue). Line indicates the classifier threshold. (B–D) T cell test score, defined as log-odds of the probability of the logistic regression model (B), EUROIMMUN IgG OD ratio (C), and Abbott ARCHITECT assay index (D) as a function of time from symptom onset for hospitalized (blue) or nonhospitalized (red) individuals for 357 samples from 302 convalescent individuals. Trend lines connect visit 1 and visit 2 samples from the same individual. Blue and red bold trend lines indicate smoothed means (locally estimated scatterplot smoothing, LOESS; ref. 56) for hospitalized and nonhospitalized individuals. Significance was evaluated by Spearman’s rank-order correlation. (E and F) T cell test scores versus EUROIMMUN IgG OD ratio (E) or Abbott ARCHITECT index (F) for 357 samples from 302 convalescent individuals. Samples classified negative by all 3 antibody tests (EUROIMMUN, Abbott ARCHITECT, nAb titer) are highlighted in orange. Black dashed lines indicate cutoffs for positivity/negativity. The cutoff for nAb positivity was 1:40 (24).

