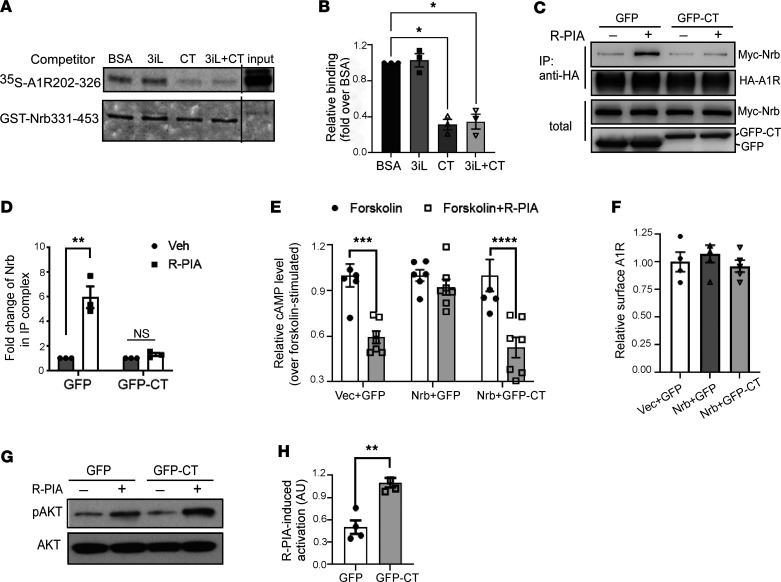
Figure 4. The A1R-CT peptide blocks the A1R-neurabin interaction and restores A1R-mediated signaling in the presence of neurabin.
(A) Competition pull-down assays testing the abilities of A1R 3i loop (3iL) and CT peptides in blocking the interaction between GST-Nrb331-453 and [35S]-labeled A1R202-326. Representative autoradiograph and Coomassie staining are shown. (B) Quantitation of the amount of [35S]A1R202-326 pulled down by GST-Nrb331-453. Free probe represents 1/10 of the input in each reaction. *P < 0.05 versus BSA control by 1-way ANOVA Dunnett’s multiple comparisons test. n = 3/group. (C) Expression of GFP-CT abolished agonist-induced interaction between neurabin and A1R in intact cells. Representative Western blots are shown. (D) Quantitation of the change of neurabin in the IP complex with HA-A1R. **P < 0.01; ns, no significance, R-PIA versus vehicle by 2-way ANOVA Sidak’s multiple comparisons test. n = 3/group. (E) Expression of GFP-CT restored A1R-mediated inhibition of cAMP production in the presence of neurabin expression. Cells stably expressing HA-A1R were cotransfected with vectors encoding indicated proteins. Vec, empty vector. Cells were treated with 10 μM forskolin alone or forskolin plus 1 μM R-PIA. Data are expressed as fold change in cAMP production over forskolin alone control. ***P < 0.001; ****P < 0.0001; forskolin+R-PIA versus forskolin by 2-way ANOVA Sidak’s multiple comparisons test. n = 6 for forskolin and n = 7 for forskolin+R-PIA in each set. (F) Expression of GFP-CT does not alter the cell surface level of A1R. n = 4/group. (G) Expression of GFP-CT enhances A1R-mediated Akt activation. Cells stably expressing HA-A1R with GFP or GFP-CT were stimulated with vehicle or 1 μM R-PIA. Representative blots are shown. (H) Quantitation of pAkt activation. The quantitative value of pAkt was normalized by that of Akt blotted on the same gel or on a separate gel that was run in parallel contemporaneously. **P < 0.01 by 2-tailed Student’s t test. n = 4/group. Error bars represent mean ± SEM.

