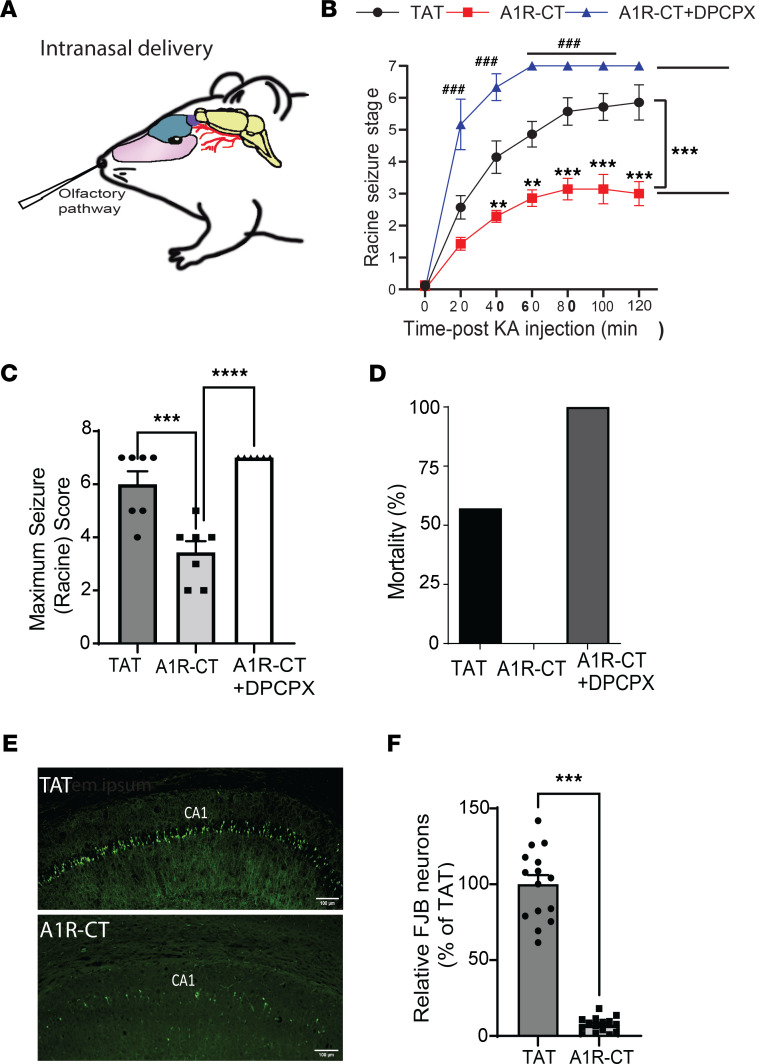
Figure 6. Intranasal delivery of the A1R-CT peptide shows effective anti-seizure and neuroprotective effects.
(A) A schematic diagram indicates the A1R-CT peptide (fused with TAT) or TAT control peptide administered into the nasal cavity. (B) Seizure severity in response to kainate is measured in mice with the indicated treatment. **P < 0.01, ***P < 0.001, A1R-CT versus TAT; ###P < 0.001, A1R-CT versus A1R-CT+DPCPX by 2-way ANOVA Tukey’s multiple comparisons test. n = 7 for TAT and A1R-CT; n = 6 for A1R-CT+DPCPX. (C) Quantitation of maximum seizure scores in mice with the indicated treatment. ***P < 0.001, A1R-CT versus TAT; ****P < 0.0001, A1R-CT versus A1R-CT+DPCPX by 1-way ANOVA Tukey’s multiple comparisons test. (D) Kainate-induced lethality is recorded in mice examined in B. Data are expressed as percentage of death. (E) Representative images of cell death in the hippocampal CA1 region as revealed by Fluoro-Jade B (FJB) staining. Scale bar: 100 μm. (F) Quantitation of the CA1 neurons with positive FJB staining. Data are expressed as the percentage of the level in TAT-treated mice (which is set as 100%). ***P < 0.001 by paired 2-tailed Student’s t test. n = 15 slices from 3 mice for TAT and n = 15 slices from 3 mice for A1R-CT. Data are mean ± SEM.

