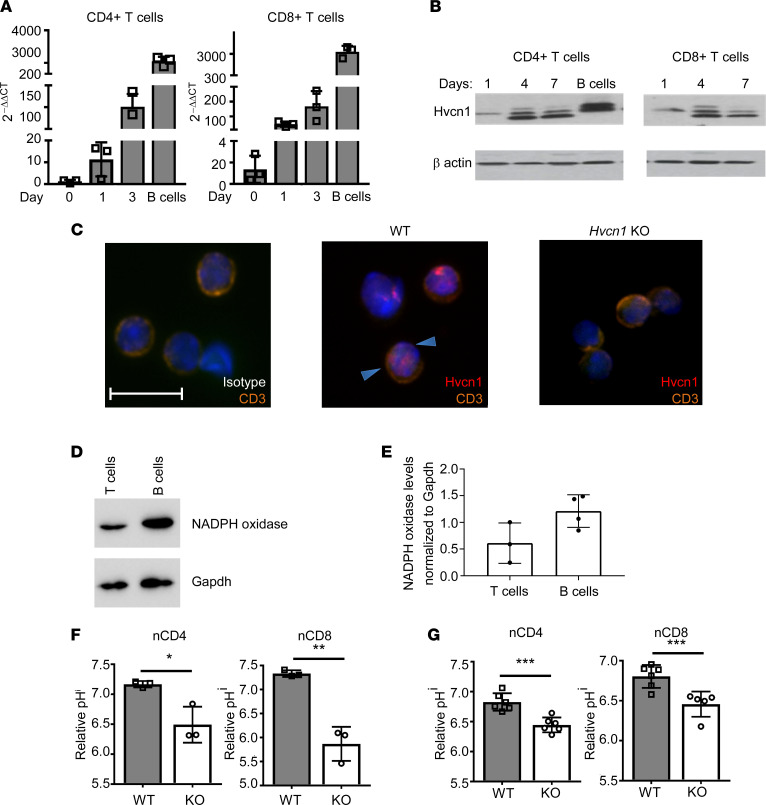
Figure 1. The proton channel Hvcn1 is expressed by T lymphocytes and regulates intracellular acidity.
T cells were purified from spleen and lymph nodes (LN) of WT mice and stimulated with plate-bound anti-CD3 (1 μg/mL) and anti-CD28 (5 μg/mL) with 20 U/mL IL-2 for the indicated number of days. Expression of Hvcn1 gene and protein was measured by quantitative PCR (qPCR) and Western blot in CD4+ and CD8+ T cell subsets (A and B, respectively). (C) LN T cells from WT and Hvcn1-deficient mice were stained with DAPI (blue), anti-CD3 (orange) and anti-Hvcn1 (red) Abs and visualized by confocal microscopy. Scale bar: 10 μm. (D and E) Total T cells and B cells were isolated from WT mice (n = 3) and the protein extract resolved by SDS gel electrophoresis. NADPH oxidase levels were normalized to GAPDH levels. (F and G) Relative pHi of naive (n)CD4+ and nCD8+ (n = 3, F) and Ab-activated (day 4, G) CD4+ and CD8+ (n = 6) WT and Hvcn1-deficient (KO) T cells was calculated by staining with pHRodo. Results are presented as mean ± SD. *P < 0.05, **P < 0.01, ***P < 0.005; 2-tailed Student’s t test.

