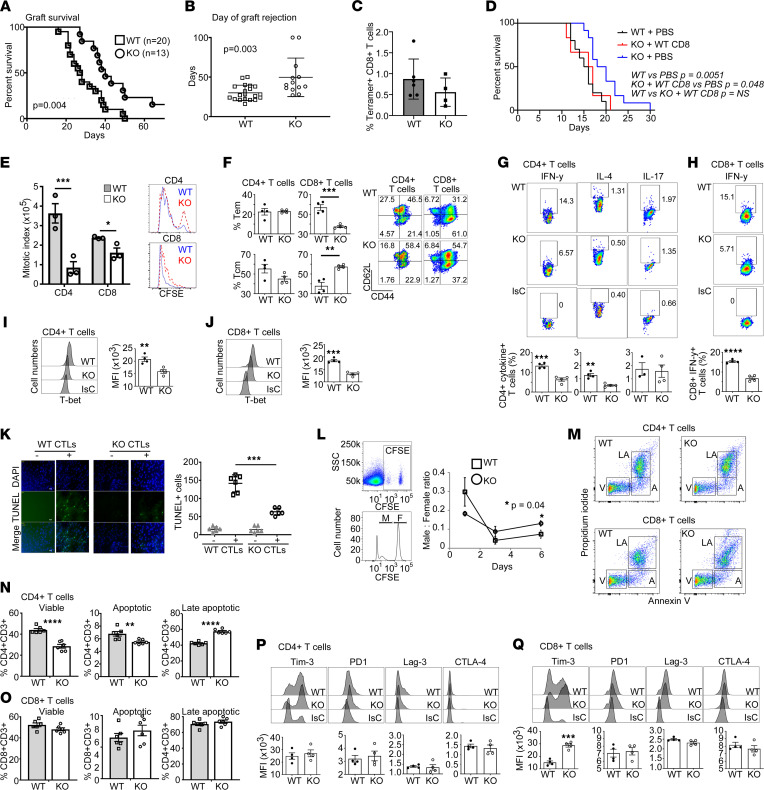
Figure 2. Functional features of Hvcn1-deficient T cells.
(A and B) WT male-derived skin rejection by WT (n = 20) and Hvcn1-deficient (KO, n = 13) female mice ± SD. (C) Percentage of tetramer-positive CD8+ T cells in female mice after male-skin rejection. (D) Survival of B6Kd skin in WT (n = 8), Hvcn1-deficient (KO, n = 10) mice, and Hvcn1-deficient mice CD8+ T cell-depleted/repleted with 5 × 10⁵ WT cells (n = 10). (E) Cell Trace Violet-labeled naive CD4+ and CD8+ T cell proliferation. (F) T cell subsets after proliferation. Representative histograms and bar charts of mean data (n = 3, n = 3) are displayed ± SD. (G and H) Cytokine production and (I and J) T-bet expression measured in T cells ± SD (n = 4) with representative dot plots. (K) TUNEL assay of Balb/C-derived IFN-γ–activated ECs cocultured for 5 hours with WT or Hvcn1-deficient Ab-activated CD8+ T cells. Representative images and mean number of apoptotic endothelial cells (ECs) are shown ± SD (n = 5). Scale bar: 20 μm. (L) In vivo killing of female (F) or male (M) WT splenocytes stained with high and low CFSE concentrations by WT or Hvcn1-deficient females. Representative plot and histogram of differentially labeled splenocytes and proportion of CFSE hi (♀) to CFSE lo (♂) cells calculated 1 day later ± SD. (M–O) Viability of WT or Hvcn1-deficient T cells. Representative dot plots (M) and bar charts of mean apoptotic (A), late-apoptotic (LA), and viable (V) T cell proportions (N and O) ± SD (n = 6). (P and Q) Cell marker expression by Ab-stimulated CD4+ or CD8+ T cells. Results presented as bar charts ± SD (n = 4), with representative histograms. A and D, log-rank (Mantel-Cox) test. B, C, and E–Q, 2-tailed Student’s t test; *P < 0.05, **P < 0.01, ***P < 0.005, ****P < 0.001.

