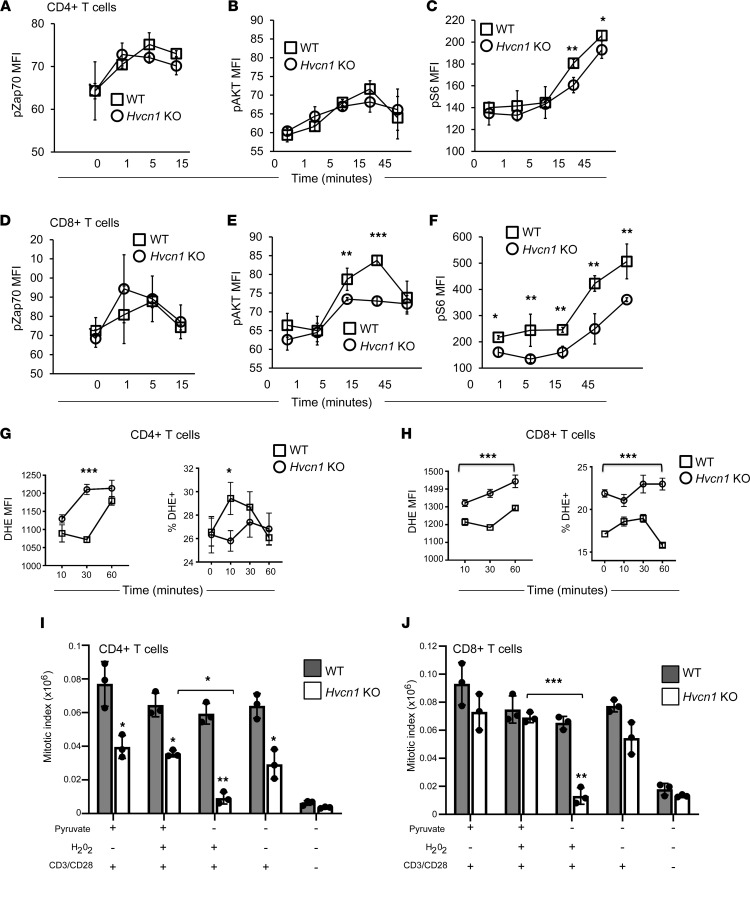
Figure 3. Altered TCR signaling and ROS production by Hvcn1-deficient T cells.
Phosphorylation of Zap70, AKT, and S6 was measured by flow cytometry in purified naive WT or Hvcn1-deficient CD4+ (A–C) and CD8+ (D–F) T cells after Ab activation for the indicated time. Results are presented as the mean MFI ± SD. (n = 3 independent experiments.) (G and H) Production of superoxide was evaluated by staining nCD4+ and nCD8 with DHE before activating with anti-CD3/28 + 20 U/mL IL-2 at the indicated time points. Cells were analyzed by flow cytometry. Right-hand side panels show the mean MFI (level) of DHE production, while the left-hand side graph shows the mean percentage of T cells producing DHE (± SD, n = 4). (I and J) Purified naive WT or Hvcn1-deficient CD4+ or CD8+ T cells were stained with Cell Trace Violet and then activated in culture with or without the indicated supplements and with 20 U/mL IL-2. On day 4, cells were harvested and counted. The mitotic index was calculated as a function of the number of cells and the percentage of cells in each division, as assessed by flow cytometry. Data are presented as mean ± SD. Student’s 2-sided t test and 1-way ANOVA with Tukey post hoc test. *P < 0.05; **P < 0.01; ***P < 0.005.

