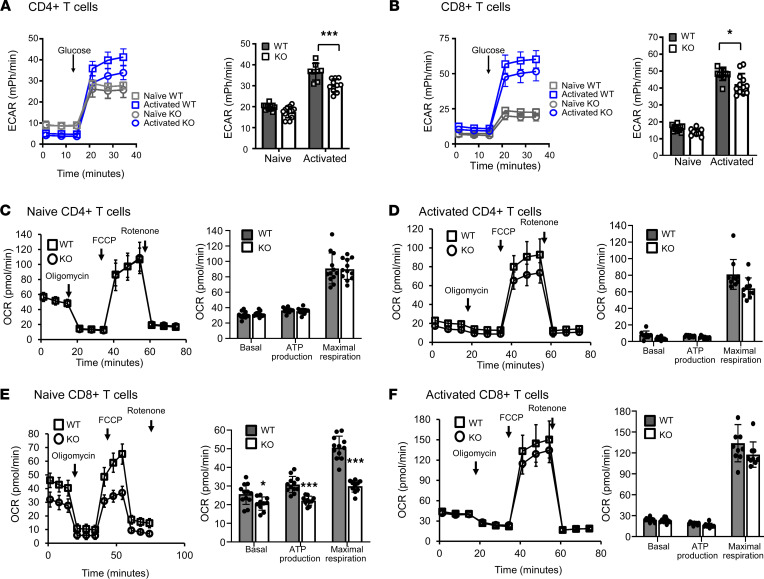
Figure 4. Altered metabolic responses by Hvcn1-deficient naive T cells.
The ECAR (mPh/min) was measured in naive (gray) and 4-day activated (blue) Hvcn1-deficient (circles) and WT (squares) CD4+ (A) and CD8+ (B) T cells. The bar graph shows the mean peak ECAR measured in WT (gray bars) and Hvcn1-deficient (open bars) T cells (± SD; n = 10–12). (C–F) The OCR (pmol/min) was analyzed to evaluate OXPHOS: Naive, C and E, and activated, D and F, WT (squares) and Hvcn1-deficient (circles) CD4+, C and D, and CD8+, E and F, T cells were sequentially incubated in glucose containing media, with Oligomycin, FCCP and Antimycin plus Rotenone while the OCR was measured. The OCR was used to calculate basal and maximal respiration as well as ATP production of WT (dark gray bars) and Hvcn1-deficient (white bars) T cells (± SD; n = 10–12). Results are presented as mean ± SD (n = 5); 1-way ANOVA with Tukey post hoc test; *P < 0.05, *** P < 0.005.

