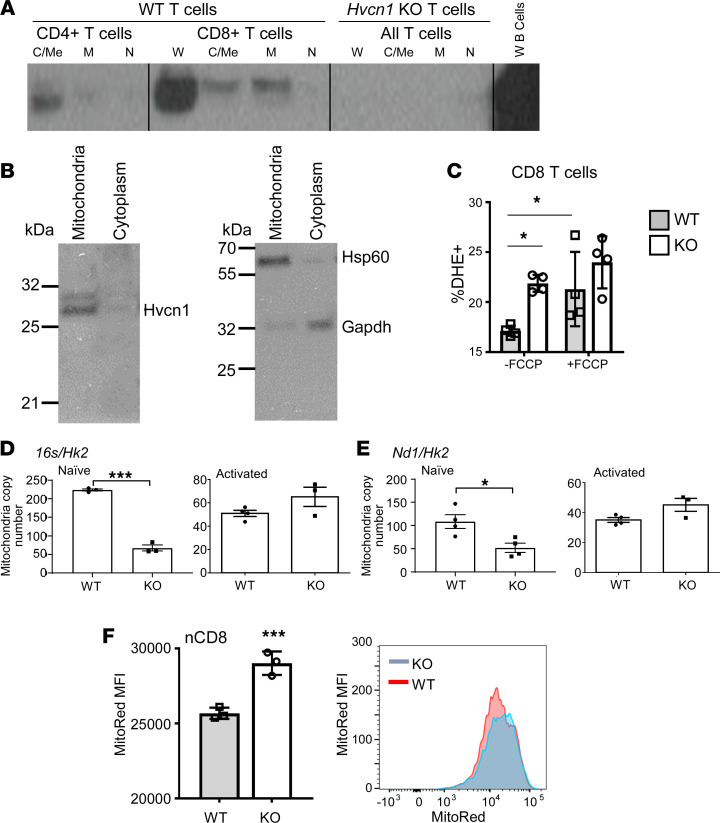
Figure 5. Hvcn1 is expressed by mitochondria and regulates mitochondrial electron transport chain.
(A and B) Purified naive CD8+ WT and Hvcn1-deficient T cells were Ab-activated for 4 days, then lysed and fractionated into Cytoplasmic/Membrane (C/Me), mitochondrial (M), and nuclear (N) and were then analyzed by Western blot for the presence of Hvcn1, Hsp60, and Gapdh proteins. (C) Naive WT and Hvcn1-deficient CD8+ T cells were incubated with or without FCCP for 5 minutes before being stained with DHE and analyzed by flow cytometry. The mean percentage of DHE+ T cells is shown (± SD, n = 4). (D and E) Total DNA was isolated from naive and Ab-activated (4 days) WT and Hvcn1-deficient CD8+ T cells (n = 3–4). Quantitative PCR was used to assess expression of mitochondrial genes 16s and Nd1 and normalized to the nuclear gene Hk2 to calculate mitochondrial DNA copy number. Data are presented as mean ± SEM (n = 5). Student’s 2-tailed t test; *P < 0.05, ***P < 0.005. (F) MMP of naive WT and Hvcn1-deficient CD8+ T cells was determined using MitoTracker Red (MitoRed). A representative histogram is shown on the right-hand side. Bar charts show mean MFI ± SD (n = 3). Data are presented as mean ± SD (n = 5). Student’s 2-tailed t test; ***P < 0.005.

