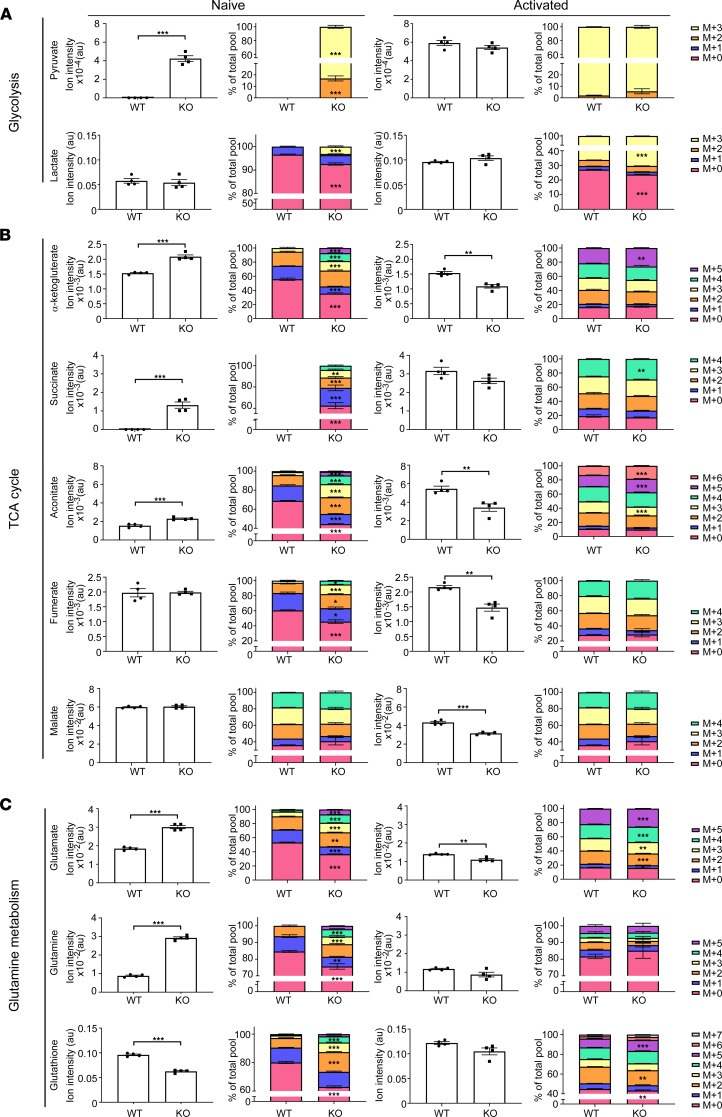
Figure 6. Metabolic analysis of Hvcn1-deficient CD8+ T cells.
Purified naive and 48-hour activated WT and Hvcn1-deficient CD8 T cells were incubated with 13C6-Glucose for 18 hours, followed by metabolite extraction for LC-MS/MS analysis. Columns 1 and 3 show total levels of each metabolite in the samples. Columns 2 and 4 show the proportion of isotopologues of each metabolite indicated by “M+n,” which designates the position in the molecule where the 13C label is found. (A–C) Fractional enrichment of glycolysis (A), TCA cycle (B), and glutamine metabolism (C) related 13C-isotopologues. Data are presented as mean ± SEM; 2-tailed Student’s t test; *P < 0.05, **P < 0.01, ***P < 0.001; or Mann-Whitney test. Source data for this figure are available as supplemental material (Supplemental Data).

