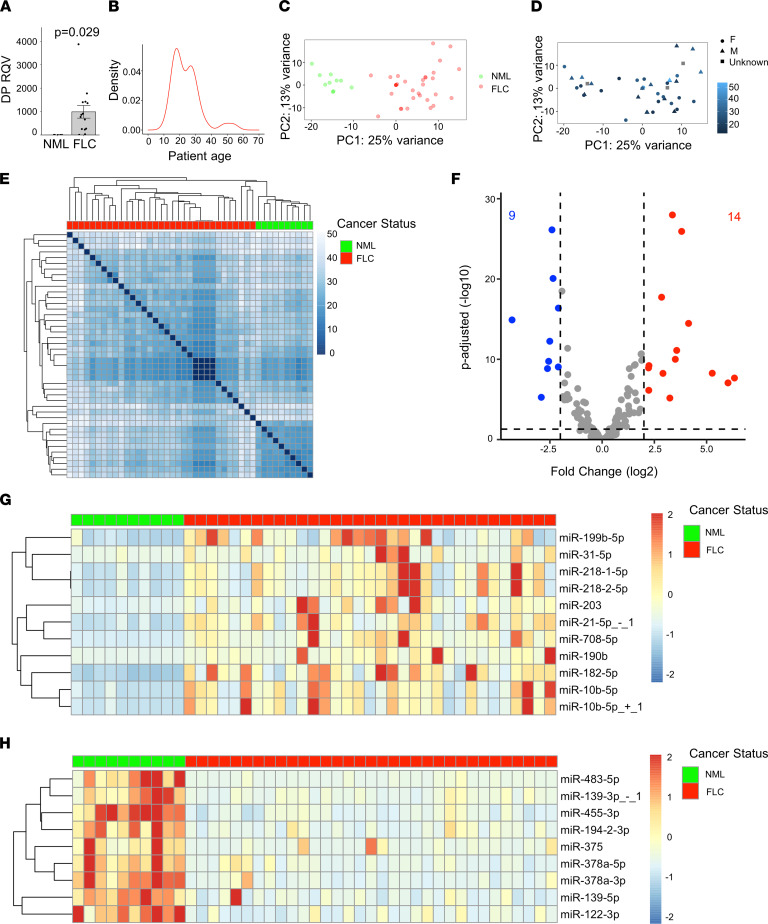
Figure 1. miR-10b is among the most upregulated microRNAs in FLC.
(A) qPCR showing the relative quantitative value (RQV) of DP in a subset of FLC samples (n = 15) compared with NML samples (n = 6). Data points represent individual patient samples. Cycle threshold values can be found in Supplemental Table 1. (B) Patient age distribution across FLC samples used in this study for which age is known (n = 35). (C) Principal component analysis of VST normalized counts for the NML (n = 10) and FLC (n = 33) data sets. The percent of variation explained is indicated for component 1 (x axis) and component 2 (y axis). NML and FLC samples are colored green and red. (D) Principal component analysis plot in which the patient age and sexual phenotype information are overlaid. Female, male, and unreported patients are indicated by circles, triangles, and squares, respectively. The color intensity, from dark to light, indicates increasing patient age at the time of surgery. (E) Unsupervised hierarchical clustering of the Euclidean distances among samples was calculated based on VST normalized counts. FLC and NML samples are indicted by red and green boxes. (F) Volcano plot showing microRNAs that are significantly differentially expressed (average normalized counts > 1000 in either NML or FLC, coefficient of variance < 2 across FLC samples). Dashed lines represent the log2 FC of expression –2/+2 (vertical) and adjusted P = 0.05 (horizontal). Up- or downregulated microRNAs are colored red or blue, respectively. (G and H) Heatmaps showing the normalized expression of up- or downregulated microRNAs (in rows) in each patient sample (in columns). Expression is scaled by row with a max/min of +2/–2 shown. P values are calculated by 2-tailed Student’s t test.

