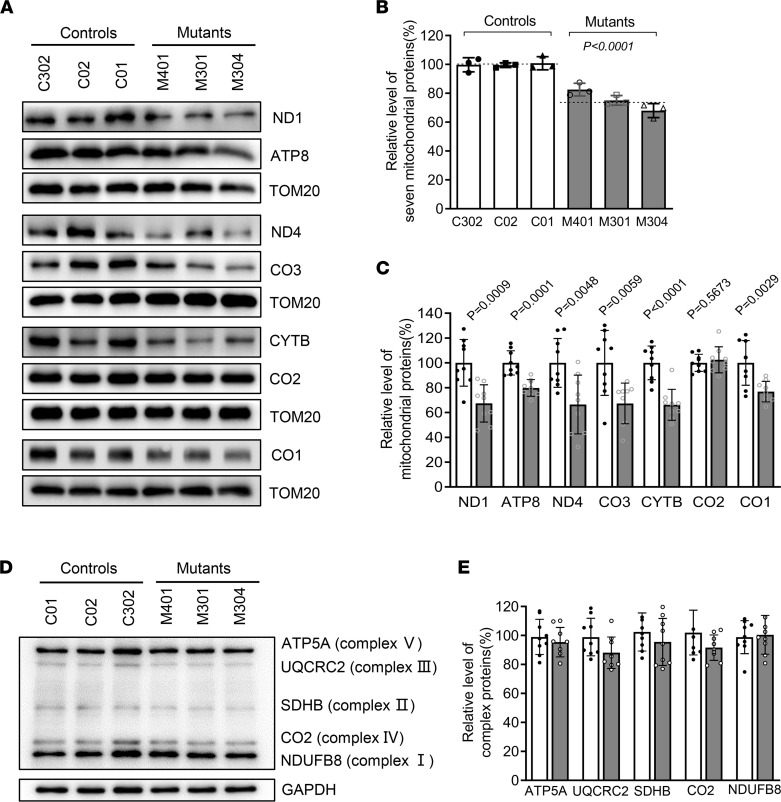
Figure 6. Western blot analysis of mitochondrial proteins and OXPHOS subunits.
(A) Western blot analysis of mitochondrial proteins. In total, 20 μg of total proteins extracted from cells were denatured and electrophoresed on a 10% SDS–PAGE gel. The gel was electroblotted and probed with the primary Abs specific for ND1, ND4, CYTB, CO1, CO2, CO3, and ATP8, with TOM20 as the loading control. (B and C) Quantification of total mitochondrial protein levels and 7 polypeptide levels. The values for the mutant cell lines were expressed as percentages of the values for the control cell lines. (D) Western blot analysis of OXPHOS subunits. A total of 20 μg of total cellular protein were electrophoresed and hybridized with an Ab cocktail specific for subunits of each OXPHOS complex and with GAPDH as the loading control. (E) Quantification of the levels of ATP5A, UQCRC2, SDHB, CO2, and NDUFB8 in mutant and control cell lines. Solid column shows mutant cells. The data are expressed as the means ± SD based on 3 independent experiments. Student’s t test was performed to determine statistically significant differences.

