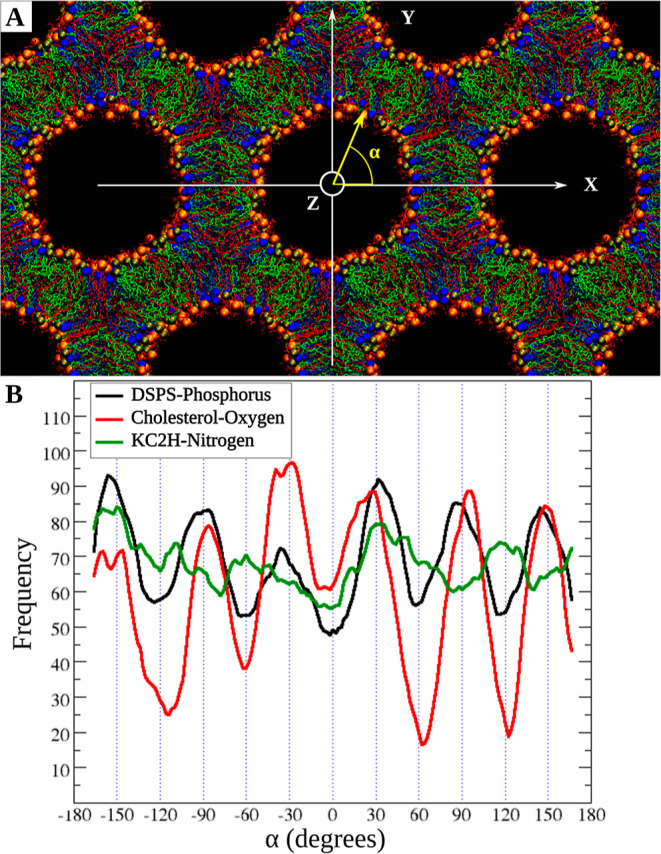
Figure 2.

Lipid angular distribution around the cylinder axis. (A) Snapshot at 300 ns for the DSPS/KC2H/cholesterol (35/35/30) system with 30 nw at 313 K. α is the polar angle with respect to the +X direction. The color code for the lipids is the same as in Figure 1B. Water and hydrogens are not shown for clarity. (B) Angular distribution of each lipid type. Black, red, and green lines are running averages over histograms of DSPS, cholesterols, and KC2H. The Y-axis shows the angular frequency for each lipid type.
