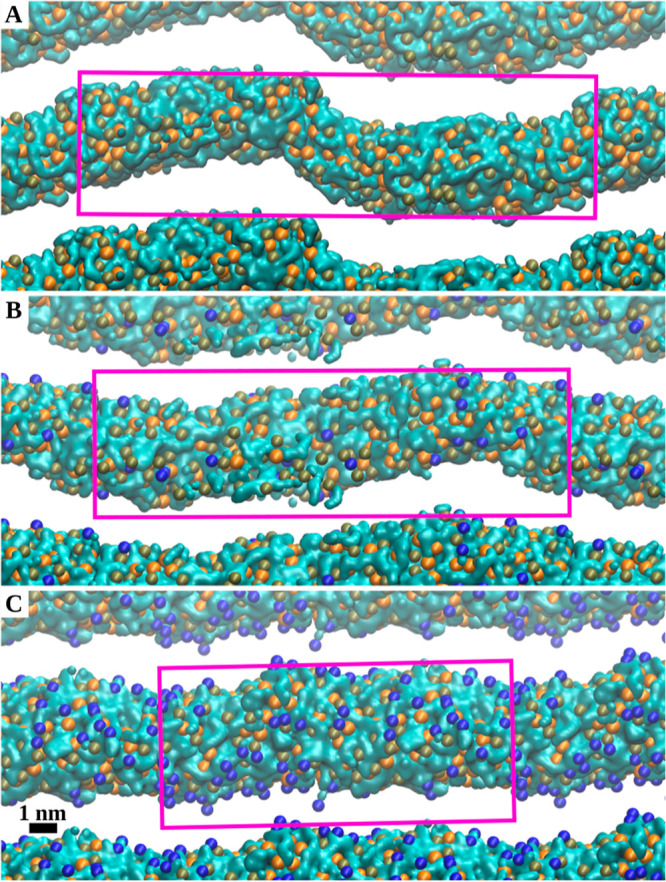
Figure 3.

Effect of the cholesterol concentration on the shape of DSPS/KC2H/cholesterol lipid cylinders. The water cores in DSPS/KC2H/cholesterol systems with DSPS/KC2H/cholesterol ratios of (A) (50/50/0), (B) (45/45/10), and (C) (35/35/30) are shown. All systems correspond to simulations with 10 nw at 313 K. The final frames of each simulated system were used to create the figures. Water is shown as a cyan surface. The orange, tan, and dark blue spheres represent the P atoms of DSPS, N atoms of KC2H, and O atoms of cholesterols, respectively. The lipid tails and cholesterols’ bodies are not shown for clarity. The pink box represents the simulation box in the ZY plane.
