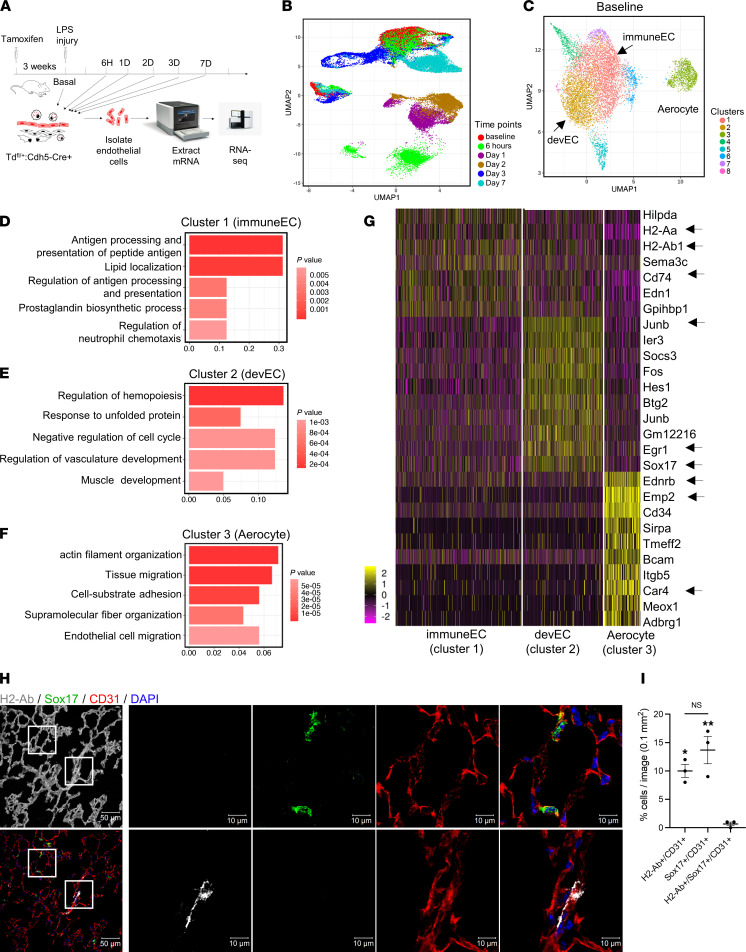
Figure 1. Overview of scRNA-Seq of lung ECs and characterization of baseline lung EC subpopulations.
(A) Schematic diagram of single-cell analysis of lung ECs at different time points using 10x Genomics Chromium platform. (B) Two-dimensional UMAP representation of 35,973 individual lung ECs obtained from all time points. Different time points are labeled as different colors. (C) UMAP of 8191 individual lung ECs at baseline. Different colors indicate distinct clusters. immuneEC, immune EC subpopulation; devEC, developmental EC subpopulation. The third subpopulation was labeled as “aerocyte” (Car4+). (D–F) The GO terms of cluster 1 (D), cluster 2 (E), and cluster 3 (F) during homeostasis (basal state) indicate the enriched biological processes in each cluster. P values are indicated on the left in a color scale. The x axis represents the percentage of differentially expressed genes in each GO term. (G) Heatmap of the most differentially expressed genes of lung ECs in cluster 1 (immuneECs), cluster 2 (devECs), and cluster 3. The color bars indicate gene expression level in log2 scale. (H) Confocal images of frozen lung sections during homeostasis immunostaining for CD31 (red), H2-Ab (gray), and Sox17 (green). The lung structure is shown as the first image by enhancing autofluorescence of lung tissue. The 2 regions in the white squares are shown at higher magnification in the right panels. Nuclei were stained by DAPI. Scale bars: 50 μm on left; 10 μm on right. (I) Quantification of CD31+/H2-Ab+, CD31+/Sox17+, and CD31+/Sox17+/H2-Ab+ cells in lung sections. Data are shown as mean ± SEM from 3 independent mice. **P < 0.01 and *P < 0.05 compared with Td+/Sox17+/Irf7+ cells by 1-way ANOVA.

