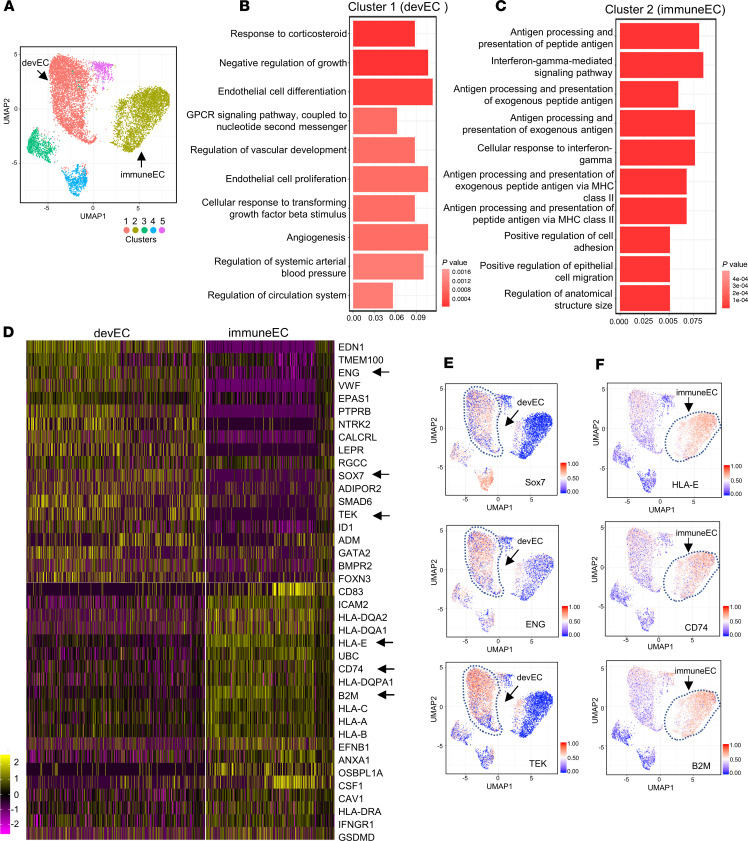
Figure 2. Identification of human lung microvascular EC subpopulations.
(A) UMAP of 18,253 nondiseased human individual lung ECs. Different colors indicate distinct clusters. immuneEC, immune EC subpopulation; devEC, developmental EC subpopulation. (B and C) The GO terms of cluster 1 (B) and cluster 2 (C) indicate the enriched biological processes in developmental signature (B) and inflammatory feature (C). P values are indicated on the left in a color scale. The x axis represents the percentage of differentially expressed genes in each GO term. (D) Heatmap of the most differentially expressed genes of lung ECs in cluster 1 (immuneECs) and cluster 2 (devECs). The color bars indicate gene expression level in log2 scale. Arrows highlight genes shown in E and F. (E and F) UMAP of visualization of expression levels of the representative marker genes in devEC (E) and immuneEC (F). The color bars in UMAP indicate gene expression level in log2 scale.

