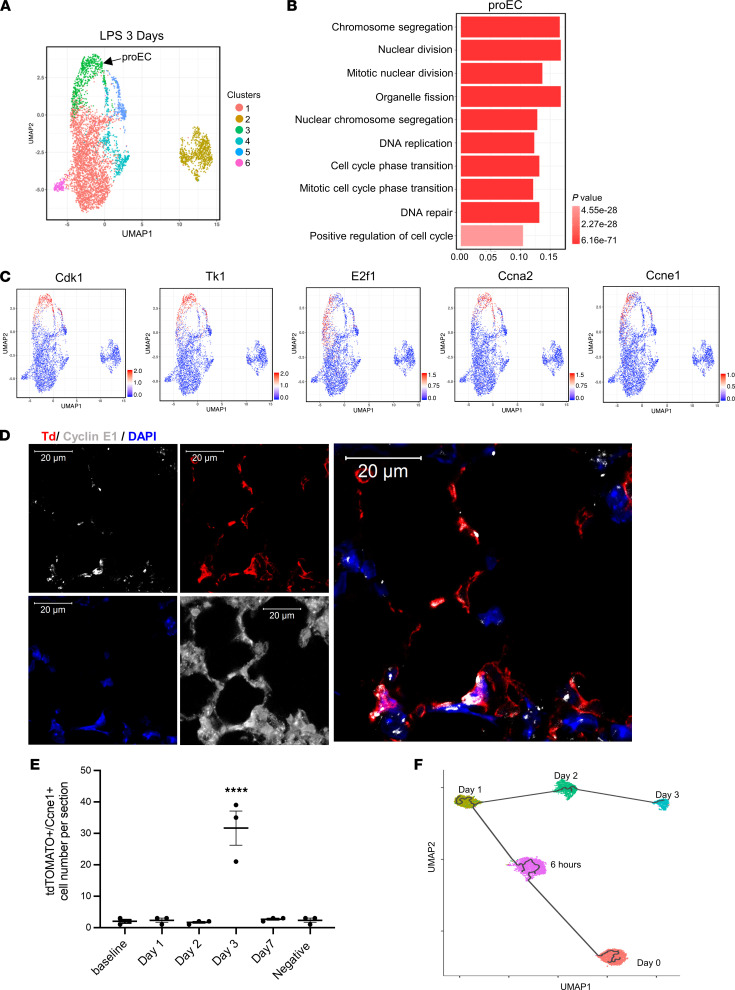
Figure 5. Identification of the proliferative lung EC subpopulation during the regeneration phase.
(A) UMAP of 5318 individual lung ECs isolated at 3 days after systemic LPS injury. (B) The GO terms indicate the enriched biological processes of proEC. P values are indicated on the left in a color scale. (C) The expression levels of representative marker genes are visualized by UMAP. The color bars in UMAP indicate gene expression level in log2 scale. (D) Confocal images of RNA-FISH of mouse lung sections obtained at 3 days after LPS injury. The lung structures are shown in D by enhancing autofluorescence of lung tissues. The lung ECs express tdTomato (Td). The RNAs of Ccne1 were probed and labeled with gray. Scale bar: 20 μm. Nuclei were stained by DAPI. (E) The quantification of cell number of Td+/Ccne1+ cells in lung sections of mice at baseline, LPS 24 hours, LPS 2 days, and LPS 3 days. Data are shown as mean ± SE from 3 independent mice at different time points. ****P < 0.0001 compared with baseline by 1-way ANOVA. (F) Pseudo-time trajectory of devECs from baseline, LPS 6 hours, LPS 1 day, LPS 2 days, and proEC of LPS 3 days. Colored by time points of LPS treatment.

