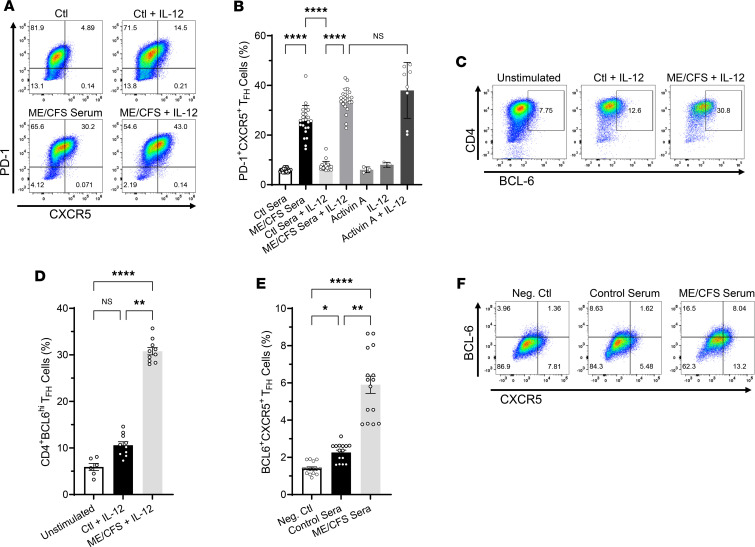
Figure 2. ME/CFS sera drive TFH cell differentiation of human naive CD4+ T cells in vitro.
Naive CD4+ T cells (CD4+CD45RA+CD197+) were isolated from human PBMCs by magnetic bead negative selection and cultured in vitro with anti-CD3/anti-CD28–coated beads in the presence of control or ME/CFS sera (2.5% vol/vol) with or without IL-12 (5 ng/mL), or activin A (Act A; 100 ng/mL) with or without IL-12 and IL-12 only. After 3 days, cells were examined for expression of the TFH markers PD-1, CXCR5, and BCL6 by FACS analysis. (A) Representative FACS plots indicating PD-1+CXCR5+ TFH cell frequency (upper right quadrant) and (B) quantitative bar graph of percentage of PD-1+CXCR5+ cells following human naive CD4+ T cell stimulation for 3 days as described above; n = 24 activin A and IL-12, controls n = 3–8. Cells activated with anti-CD3/anti-CD28 beads in the presence of activin A plus IL-12 were used as positive control for TFH cell differentiation, while cells stimulated with beads only were used as the negative control. (C–F). Frequency of CD4+BCL6+ TFH cells (C) and BCL6+CXCR5+ TFH cells (F; upper right quadrants). Quantitative bar graph of percentage of CD4+BCL6+ n = 6–10 (D) and BCL6+CXCR5+ n = 15 (E) cells differentiated as described above. FACS samples were pregated on CD4+ and fixable viability dye eFluor 780 negative (live cells). Data represent 3 independent experiments with mean ± SEM. *P < 0.05, **P < 0.01, ****P < 0.0001 of treatment groups versus controls by 1-way ANOVA Kruskal-Wallis multiple comparisons test with Dunn’s correction.

