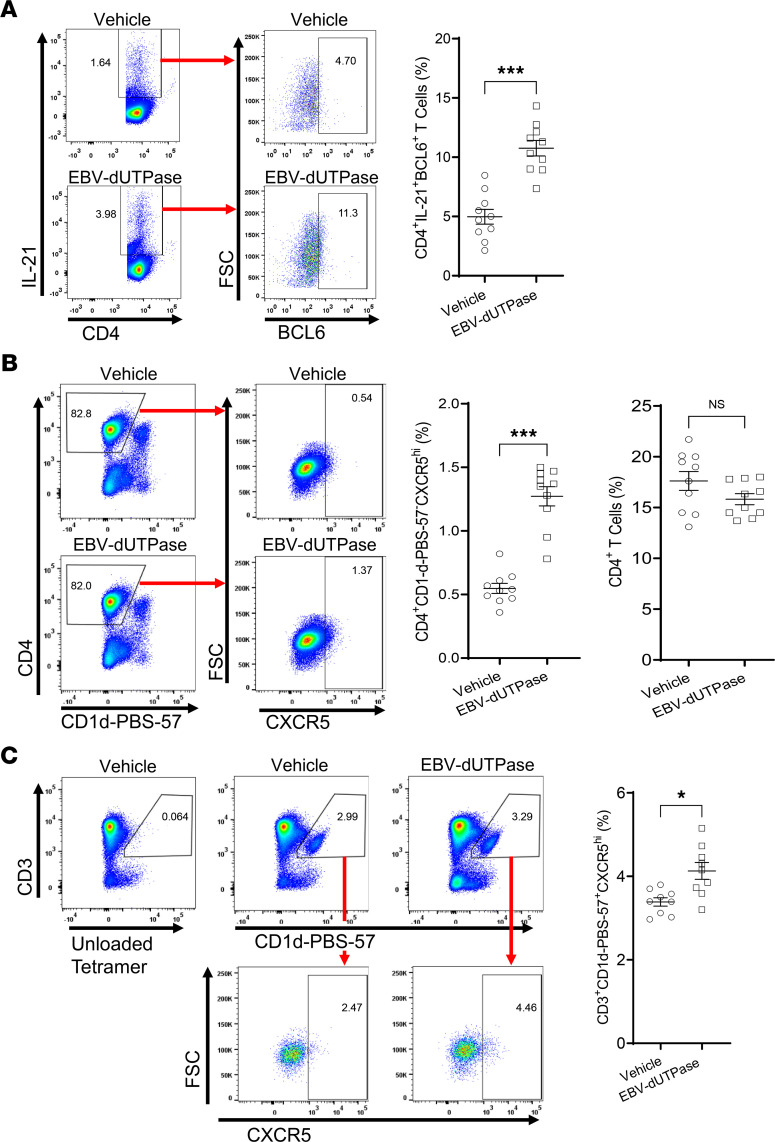
Figure 7. EBV dUTPase injections induce TFH cell differentiation and the formation of NKTFH cells in spleens of C57BL/6 female mice.
(A) Spleen single-cell suspensions (splenocytes) from EBV dUTPase– or vehicle-injected mice for 5 consecutive days were prepared as described in Methods. Cells were immediately stained with Abs against CD4, IL-21, BCL6, CD19 (B cells), CD11b (monocytes), and CD11c (DC), and the expression of TFH markers IL-21 and BCL6 was examined by flow cytometry analysis. Flow cytometry analysis was conducted on the lymphocyte population and pregated on live (FVD–) CD19–CD11b–CD11c– cells. Representative flow cytometry plots indicating frequency (%) of CD4+IL-21+ cells in gate (left) or BCL6+ T cells (right) in EBV dUTPase– and vehicle control–injected mice. (B and C) Splenocytes (prepared following injections as in A) were depleted of CD19+ B cells and CD8+ T cells by magnetic cell separation using MojoSort nanobeads, as described in Methods. Enriched cells were stained with Abs against B220, CD11b, CD11c, CD4, CD3, CD1d-PBS-57 tetramer, and CXCR5, and the expression of tetramer subsets was analyzed by flow cytometry. Flow cytometry samples were pregated on live (FVD–) B220–CD11b–CD11c– cells. (B) Flow cytometry of splenic CD4+ CD1d-PBS-57 tetramer–negative T cells (gating), indicating percentage of CXCR5+ TFH cells. (C) Flow cytometry and relative frequencies of CD1d-PBS-57 tetramer–positive CD3int NKT cells in gate (left plots) or CXCR5hi NKTFH cells (right plots). Bar graph represents quantitative data of NKTFH cells in mice. Data represent the mean ± SEM of 3 independent experiments; n = 20 (10 mice/group) (A), n = 10 (5 mice/group) (B). *P < 0.05, ***P < 0.001, by 2-tailed Mann-Whitney U test (A–C).

