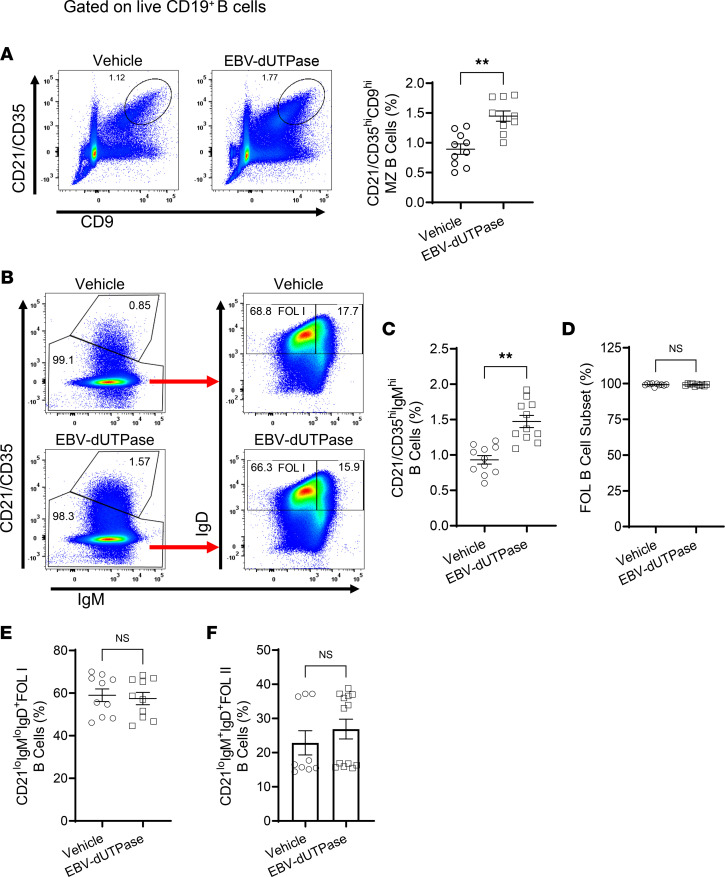
Figure 8. EBV dUTPase induces the formation of MZ B cells in spleens of C57BL/6 female mice.
Splenocytes from EBV dUTPase or vehicle injected mice for 5 consecutive days were prepared and mouse B cell subsets isolated as described in Methods. Representative flow cytometry plots and quantitative bar graphs of (A) MZ B cells (CD19+CD21/CD35hiCD9hi, (B) MZ B cell subset (CD21hiIgMhi) (left plots, top box), follicular (FOL) B cell subset (left plots, bottom box), FOL I B cells (CD21loIgMloIgD+), and FOL II B cells (CD21loIgM+IgD+) (left plots) in mice injected daily with EBV dUTPase or vehicle for 5 days. (C–F) Quantitative bar graphs of data in B. Data represent the mean ± SEM of 3 independent experiments, n = 20 (10 mice/group). **P < 0.01, by 2-tailed Mann-Whitney U test.

