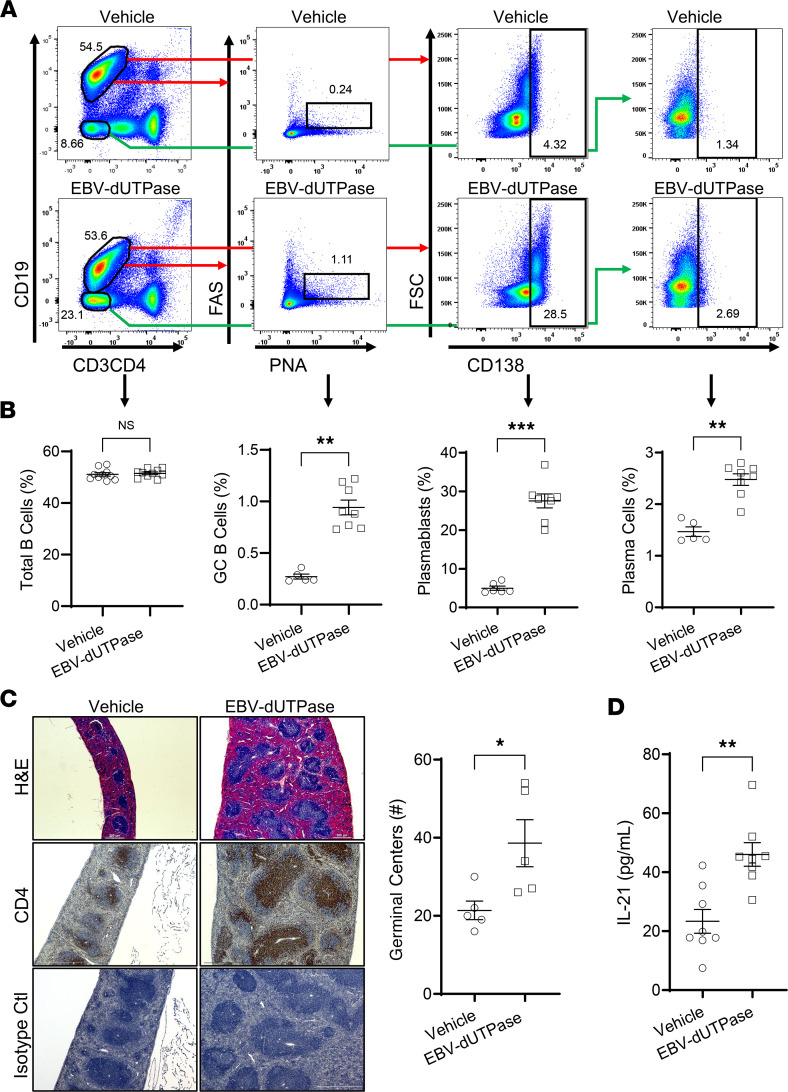
Figure 9. EBV dUTPase increases GC B cell frequencies in vivo.
(A) Representative flow cytometry plots of splenocytes from vehicle-injected (top plots) or EBV dUTPase–injected (bottom plots) mice (for 6 days) and stained with Abs against CD19, CD3, CD4, FAS, peanut agglutinin (PNA), and CD138. Values in the plots indicate the percentage of GC B cells (FAS+PNA+ — plots), plasmablasts (CD19+CD138+ — center plots), or plasma cells (CD19–CD138+ — far right plots). (B) Quantitative graphs of A indicating total B cells, GC B cells, plasmablasts, and plasma cells. (C) Staining of formalin-fixed, paraffin-embedded spleen sections from C57BL/6 mice injected as in A. H&E staining of spleen sections from vehicle- or EBV dUTPase–injected mice showing spleen size (top images), and number of GC differences (quantitative graph) between the 2 groups (31 GCs in EBV dUTPase versus 20 in vehicle, P < 0.0455 by 2-tailed Mann-Whitney test). Immunohistochemical staining of splenic CD4+ T cells (middle images). Isotype control Ab (bottom images) was used as a negative control. Original objective magnification: 5×, 300 μm scale bar (H&E top images); 10×, 500 μm scale bar (middle and bottom images). (D) ELISA of IL-21 in whole spleen lysates from EBV dUTPase– or vehicle control–injected mice. Data represent the mean ± SEM of 3 experiments, n = 16 (8 mice/group) (A and D); 2 experiments, n = 10 (5 mice/group) (C). *P < 0.05, **P = 0.008, ***P < 0.001, by 2-tailed Mann-Whitney U test.

