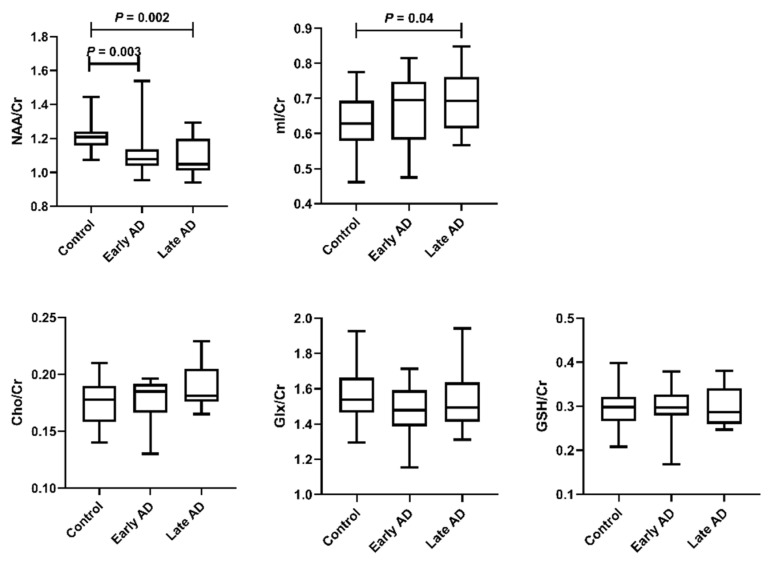
Figure 2.
Comparison of MRS metabolite levels across groups. The bars show the median and inter-quartile range. NAA/Cr was significantly different between the control and early AD groups and between the control and late AD groups. mI/Cr was significantly different between the control and late AD groups.

