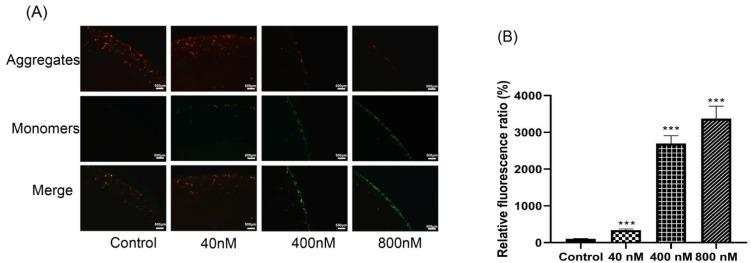
Figure 6.
(A) Changes in mitochondrial membrane permeabilization in compound 3 treated Huh-7 cells by fluorescence microscopy. (B) The level of ROS after treatment with 0, 40, 400 and 800 nM of 3 for 24 h. The average levels of ROS were expressed as mean ± SD from three different experiments. *** p < 0.001 vs. control values.

