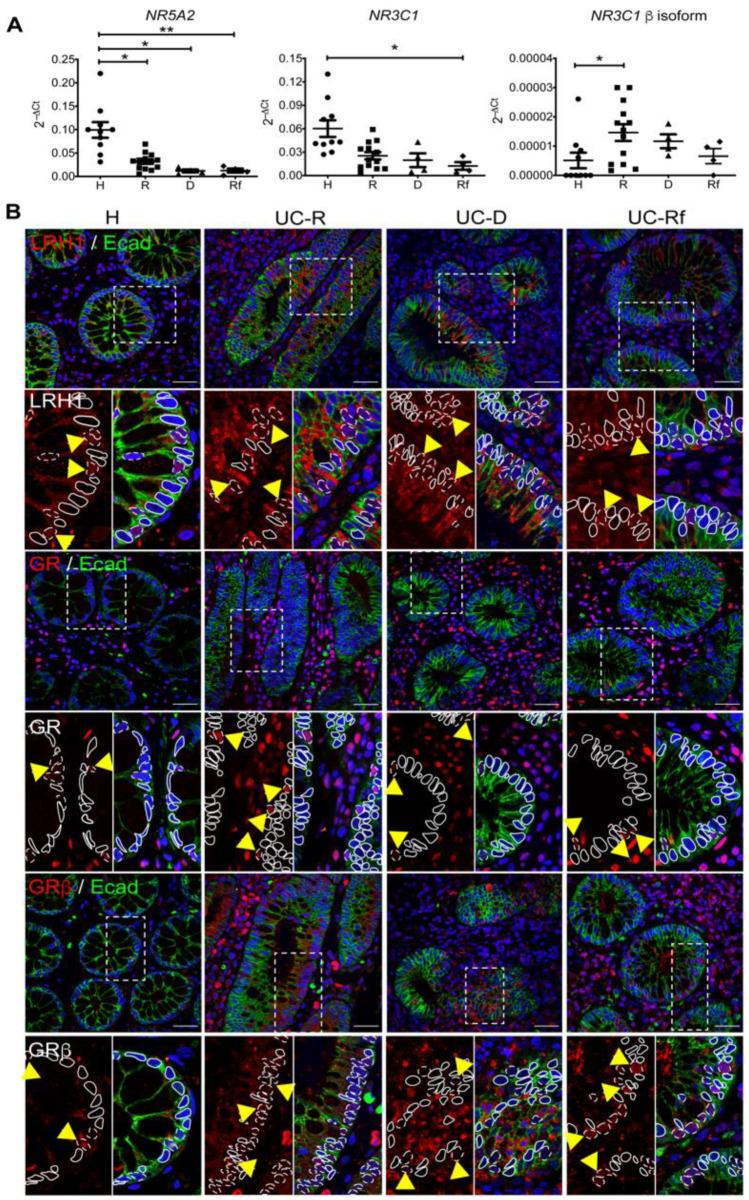
Figure 2.
LRH-1 and GRβ are upregulated in intestinal mucosa from patients with impaired GC response. (A) Transcript levels (relative to PPIB) of NR5A2, NR3C1 and NR3C1 isoform β in intestinal mucosa from healthy controls (H), responders (R), dependent (D) and refractory (Rf) UC patients by RTqPCR. Transcript levels (relative to PPIB) of NR5A2, NR3C1 and NR3C1 isoform β; differences between group medians were assessed using Kruskal–Wallis with Dunn’s post-test and Pearson correlation performed. Each point represents an individual value: non-inflamed (circles), responders (squares), dependents (triangles) and refractory (diamonds), * p < 0.05; ** p < 0.01. (B) Representative immunoreactivity of LRH-1, GR and GRβ isoform (red) in paraffin-embedded PFA-fixed sections of intestinal mucosa biopsies taken from healthy individuals and active UC patients according to their GC response by tissue array. E-cadherin (Ecad) co-localization (green) was used for epithelium recognition. In the zoomed image indicated with dashed line and yellow arrow: positive nuclear stain; solid line: negative nuclear stain. Objective 60×, scale bar 30 μm.

