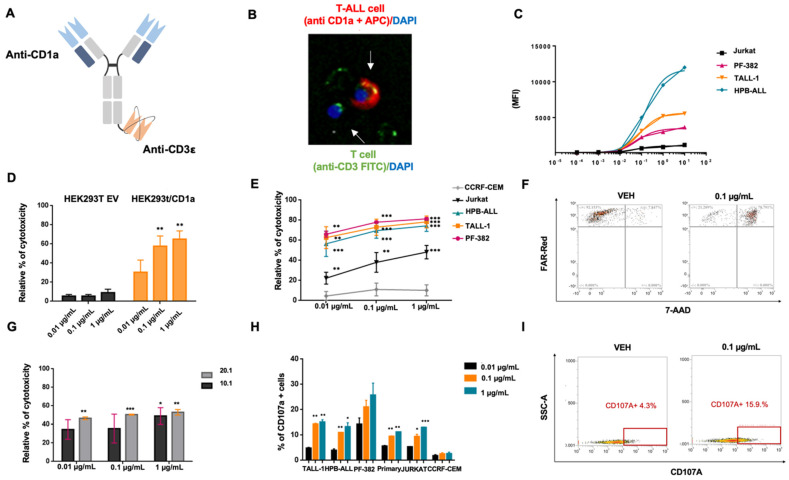
Figure 2.
CD1a x CD3ε BTCE in vitro cytotoxic activity. (A) Schematic representation of CD1a x CD3ε BTCE. (B) Coupling of CD3+ T lymphocyte on CD1a+ T-ALL cell by CD1a x CD3ε BTCE assessed by immunofluorescence microscopy. CD3+ T cells are stained with DAPI (blue) and CD3 FITC (green), CD1a+ T-ALL cells are stained with DAPI (blue) and cell trace Far Red (red). (C) Average apparent CD1a x CD3ε BTCE Kd (0.014 µg/mL) evaluated on CD1a cortical derived T-ALL cell lines. (D) Relative percentage (%) of T cell redirected cytotoxicity of CD1a x CD3ε BTCE on HEK293T transduced with empty vector (black) and with a vector encoding for CD1a (orange). (E) Relative percentage (%) of T cell redirected cytotoxicity of CD1a x CD3ε BTCE against CD1a+ and CD1a- cortical derived T-ALL cell lines. (F) Representative FACS data (dot plots) of T cell redirected cytotoxicity on T-ALL cell line (TALL-1) co-cultured with PBMCs at a 10:1 E:T ratio in the presence of vehicle or 0.1 μg/mL of CD1a x CD3ε BTCE. (G) Relative percentage (%) of T cell redirected cytotoxicity of 0.1 μg/mL of CD1a x CD3ε BTCE against primary CD1a+ T-ALL cells (one representative patient derived sample). (H) CD107a concentration-dependent increase on T lymphocytes co-cultured at a 10.1 E:T ratio with both CD1a expressing T-ALL cell lines and primary T-ALL blasts (one representative patient derived sample). (I) Representative FACS data (dot plots) of CD107a increase on T lymphocyte co-cultured with T-ALL cells at a 10:1 E:T ratio treated with vehicle or 0.1 μg/mL of CD1a x CD3ε BTCE. * p < 0.05, ** p < 0.01, *** p < 0.001. p values are calculated by comparing co-cultures of PBMCs + T-ALL exposed to vehicle with co-cultures of PBMCS + T-ALL treated with increasing concentration of CD1a x CD3ε (0.01 µg/mL, 0.1 µg/mL, and 1 µg/mL). Relative toxicity is calculated by normalizing CD1a x CD3-treated T-ALL cells co-cultured with PBMCs on negative control (co-cultures of T-ALL cells + PBMCs exposed to vehicle) placed equally to zero.

