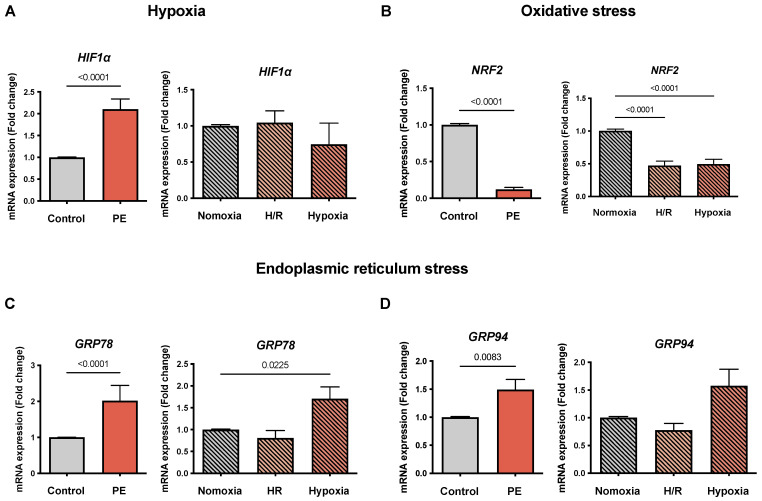
Figure 2.
The mRNA expression ofHIF1α, NRF2, GRP78, and GRP94 is selectively altered in the preeclampsia (PE) cell models. The mRNA abundance of (A) hypoxia-inducible factor 1 alpha (HIF1α), (B) oxidative stress marker nuclear factor-erythroid 2-related factor 2 (Nrf2), (C) endoplasmic reticulum stress marker 78 kDa glucose-regulated protein (GRP78), and (D) 94 kDa glucose-regulated protein (GRP94) is shown in the placental tissues of the controls (gray bar) and preeclamptic (PE, orange bar) pregnancies. The cultured CTB were placed under normoxia (24 h, gray bar with diagonal lines), H/R (6 h intervals each of normoxia and hypoxia for 24 h; light orange bar with diagonal lines), and hypoxia (24 h; dark orange bar with diagonal lines). The procedures regarding the processing of the placental tissues as well as the isolation of the CTB from the healthy term placentae are described in Materials and Methods. The gene expression was assessed by real-time PCR and normalized to the reference gene YWHAZ. Data are shown as the mean ± S.E.M. (n = 16 Controls; 13 PE; 9 CTB cultured (normoxia, H/R, and hypoxia)) and represent the fold change (2−ΔΔCq) of the mRNA expression as compared to the control or normoxia. The placental expression patterns between the control and PE were compared using the student’s t-test. For comparison of normoxia with hypoxia and H/R, ANOVA was applied. p < 0.05 was considered statistically significant.

