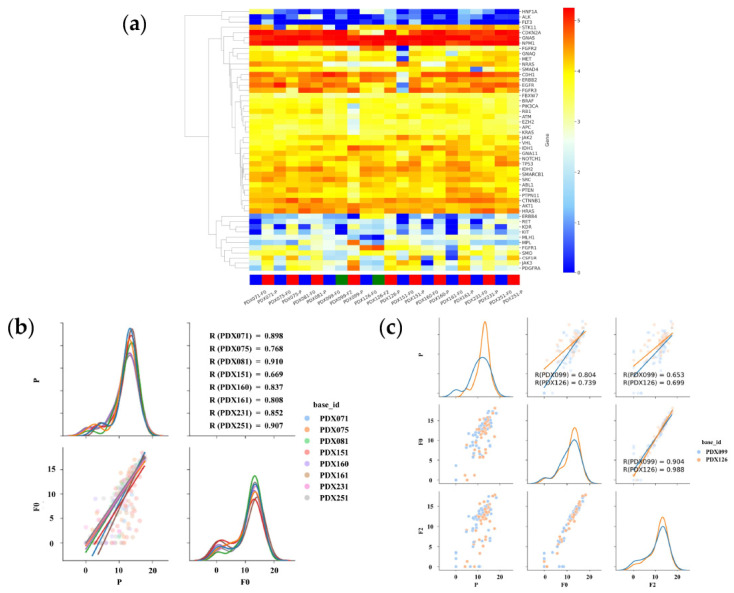
Figure 5.
Summary of the relationship between gene expression in primary and PDX tumors based on RNA sequencing (RNA-seq). (a) The clustering and heatmap analysis of the mRNA profiling in tissues of the PDX and primary tumors using the AmpliSeq RNA Cancer Panel. In all cases, gene expression in primary (P) and PDX (F0 and F2) tumors are highly correlated. (b) Pair plot showing gene expression using the AmpliSeq RNA Cancer Panel in eight PDX (71, 75, 81,151, 160, 161, 231, and 251) models. The lower-left graph shows a scatter plot and linear regression of gene expressions in the P and F0 tumors. The diagonal graph shows the KDE. In all cases, gene expression in P and F0 tumors was found to be highly correlated. (c) Pair plot showing gene expression using the AmpliSeq RNA Cancer Panel in two PDX (99 and 126) models. The graph in the middle of the left column shows a scatter plot and linear regression of gene expression in the P and F0 tumors. The graph at the bottom of the center column shows a scatter plot and linear regression of gene expression in the F0 and F2 tumors. The lower-left graph shows a scatter plot and linear regression of gene expressions in the P and F2 tumors. The diagonal graph shows the KDE. In all cases, gene expression in P and F0 tumors was found to be highly correlated. Gene expression in F0 and F2 tumors is more highly correlated. Normalized data are converted to base 10 logarithms and z-scores.

