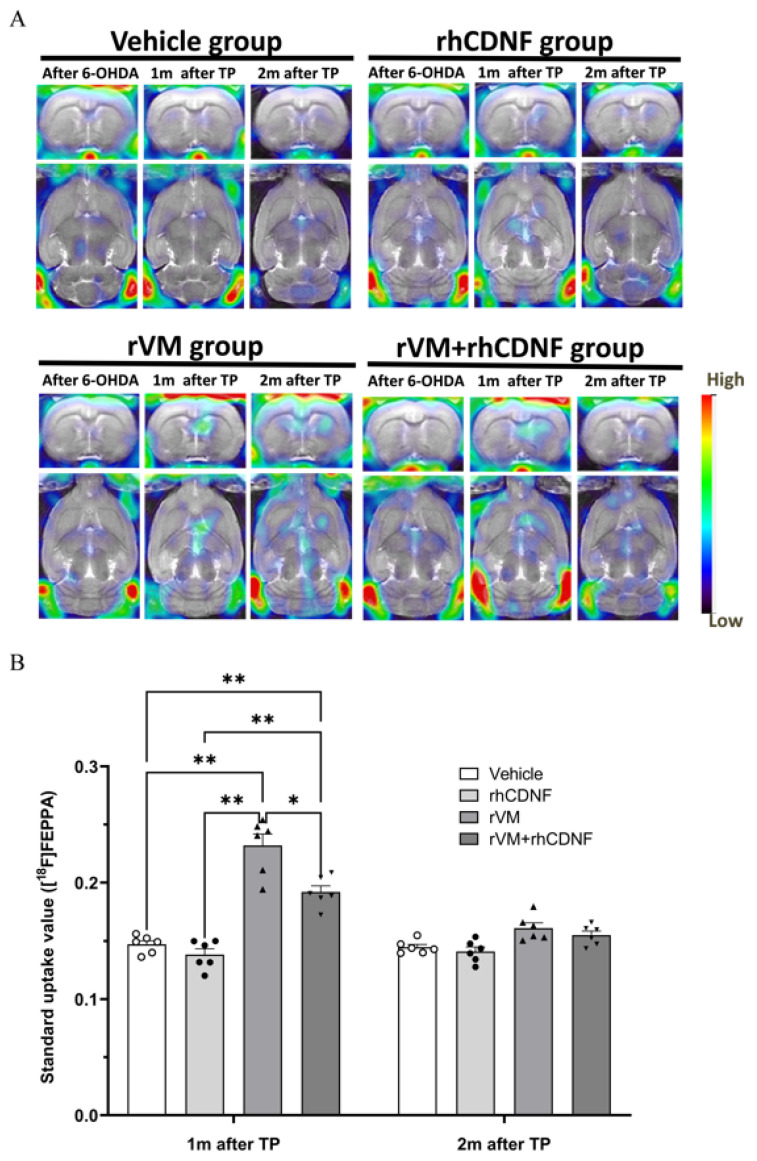
Figure 6.
PET images of [18F] FEEPA uptake distribution in rat brains. (A) Coronal (upper panel) and horizontal (lower panel) sections of each group were acquired after injection of 18F−FEEPA. Left, middle, and right columns of each group represent 18F-FEEPA uptake after the 6−OHDA lesion, at 4, and 8 weeks after transplantation, respectively. (B) Specific uptake ratios (SURs) of 18F-FEEPA of the grafted striatum at different time points and under different therapeutic regimen. * p < 0.05, ** p < 0.01 by Tukey’s multiple comparisons test, following two-way ANOVA. The data represent mean ± SEM.

