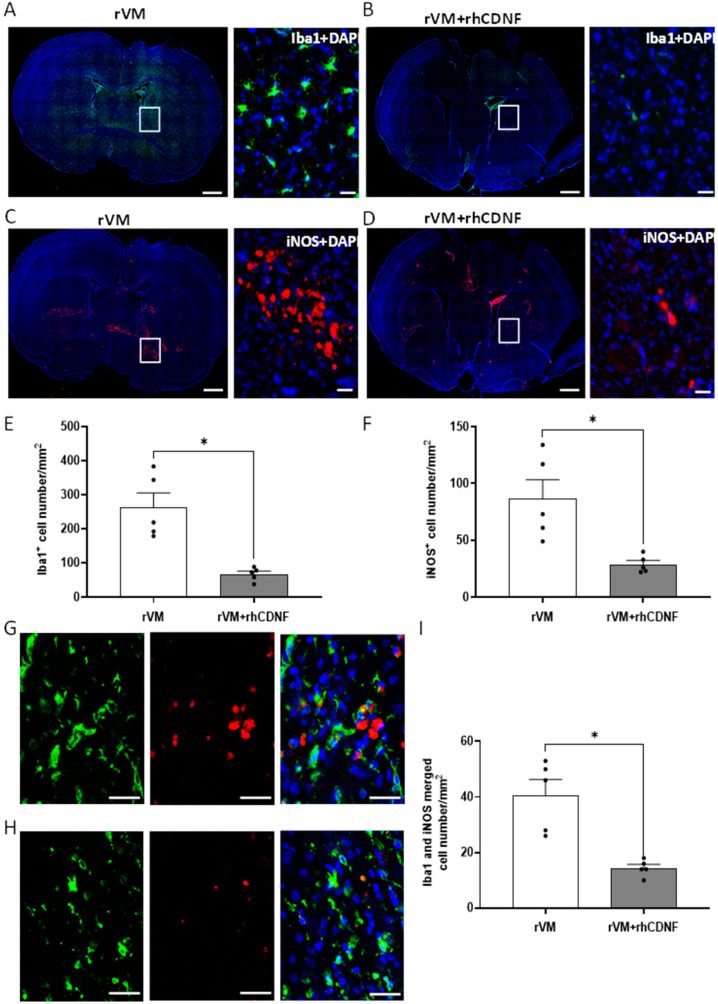
Figure 7.
Distribution of microglia/macrophage marker, Iba1, and inflammatory marker in the grafted striatum at four weeks after transplantation. (A,B) Representative images of grafted striatum sections immunostained with Iba1 and counterstained with DAPI (blue). In the rVM group, there is a large number of Iba1−positive cells in the grafted striatum (A), while less Iba1−postive staining was found in the corresponding area of rVM + rhCDNF group (B). The right column, representation of panel in left column, shows microglia/macrophage in higher magnification stained with Iba1. Scale bar = 1000 μm in left column of each group. Scale bar = 20 μm in right column of each group. (C,D) Representative images of grafted striatum immunostained with iNOS. The insets show cells in higher magnification stained with iNOS antibody. Less iNOS-positive staining was found in the grafted striatum of rVM + rhCDNF (D) compared to rVM group (D). Scale bar = 1000 μm in left column of each group. Scale bar = 20 μm in right column of each group. (E) Quantitation of Iba1-positive cells in the grafted striatum at 4 weeks after transplantation showing accumulation of microglia/macrophages in rVM group. In the rVM + rhCDNF group, there is a significant decrease in Iba1−postive microglia/macrophage density in the corresponding area. (F) Quantitation of iNOS−positive cells in the grafted striatum at 4 weeks after transplantation showing accumulation of inflammatory cells in rVM group. In the rVM + rhCDNF group, there is a significant decrease in iNOS-positive immune cell density in the corresponding area. (G,H) Section of grafted striatum at 4 weeks after transplantation double-stained with Iba1 (green) and iNOS (red). rVM + rhCDNF group (G) showed fewer Iba1− and iNOS−positive cells compared with the rVM group (H). Scale bar = 20 μm. (I) Quantification of Ib1−and iNOS−positive cell numbers * p < 0.05 indicates comparison with rVM group with Student’s t-test. The data represent mean ± SEM.

